iSuMonitor
From Blindness to Sight: Enterprise-Grade Observability as a Managed Service
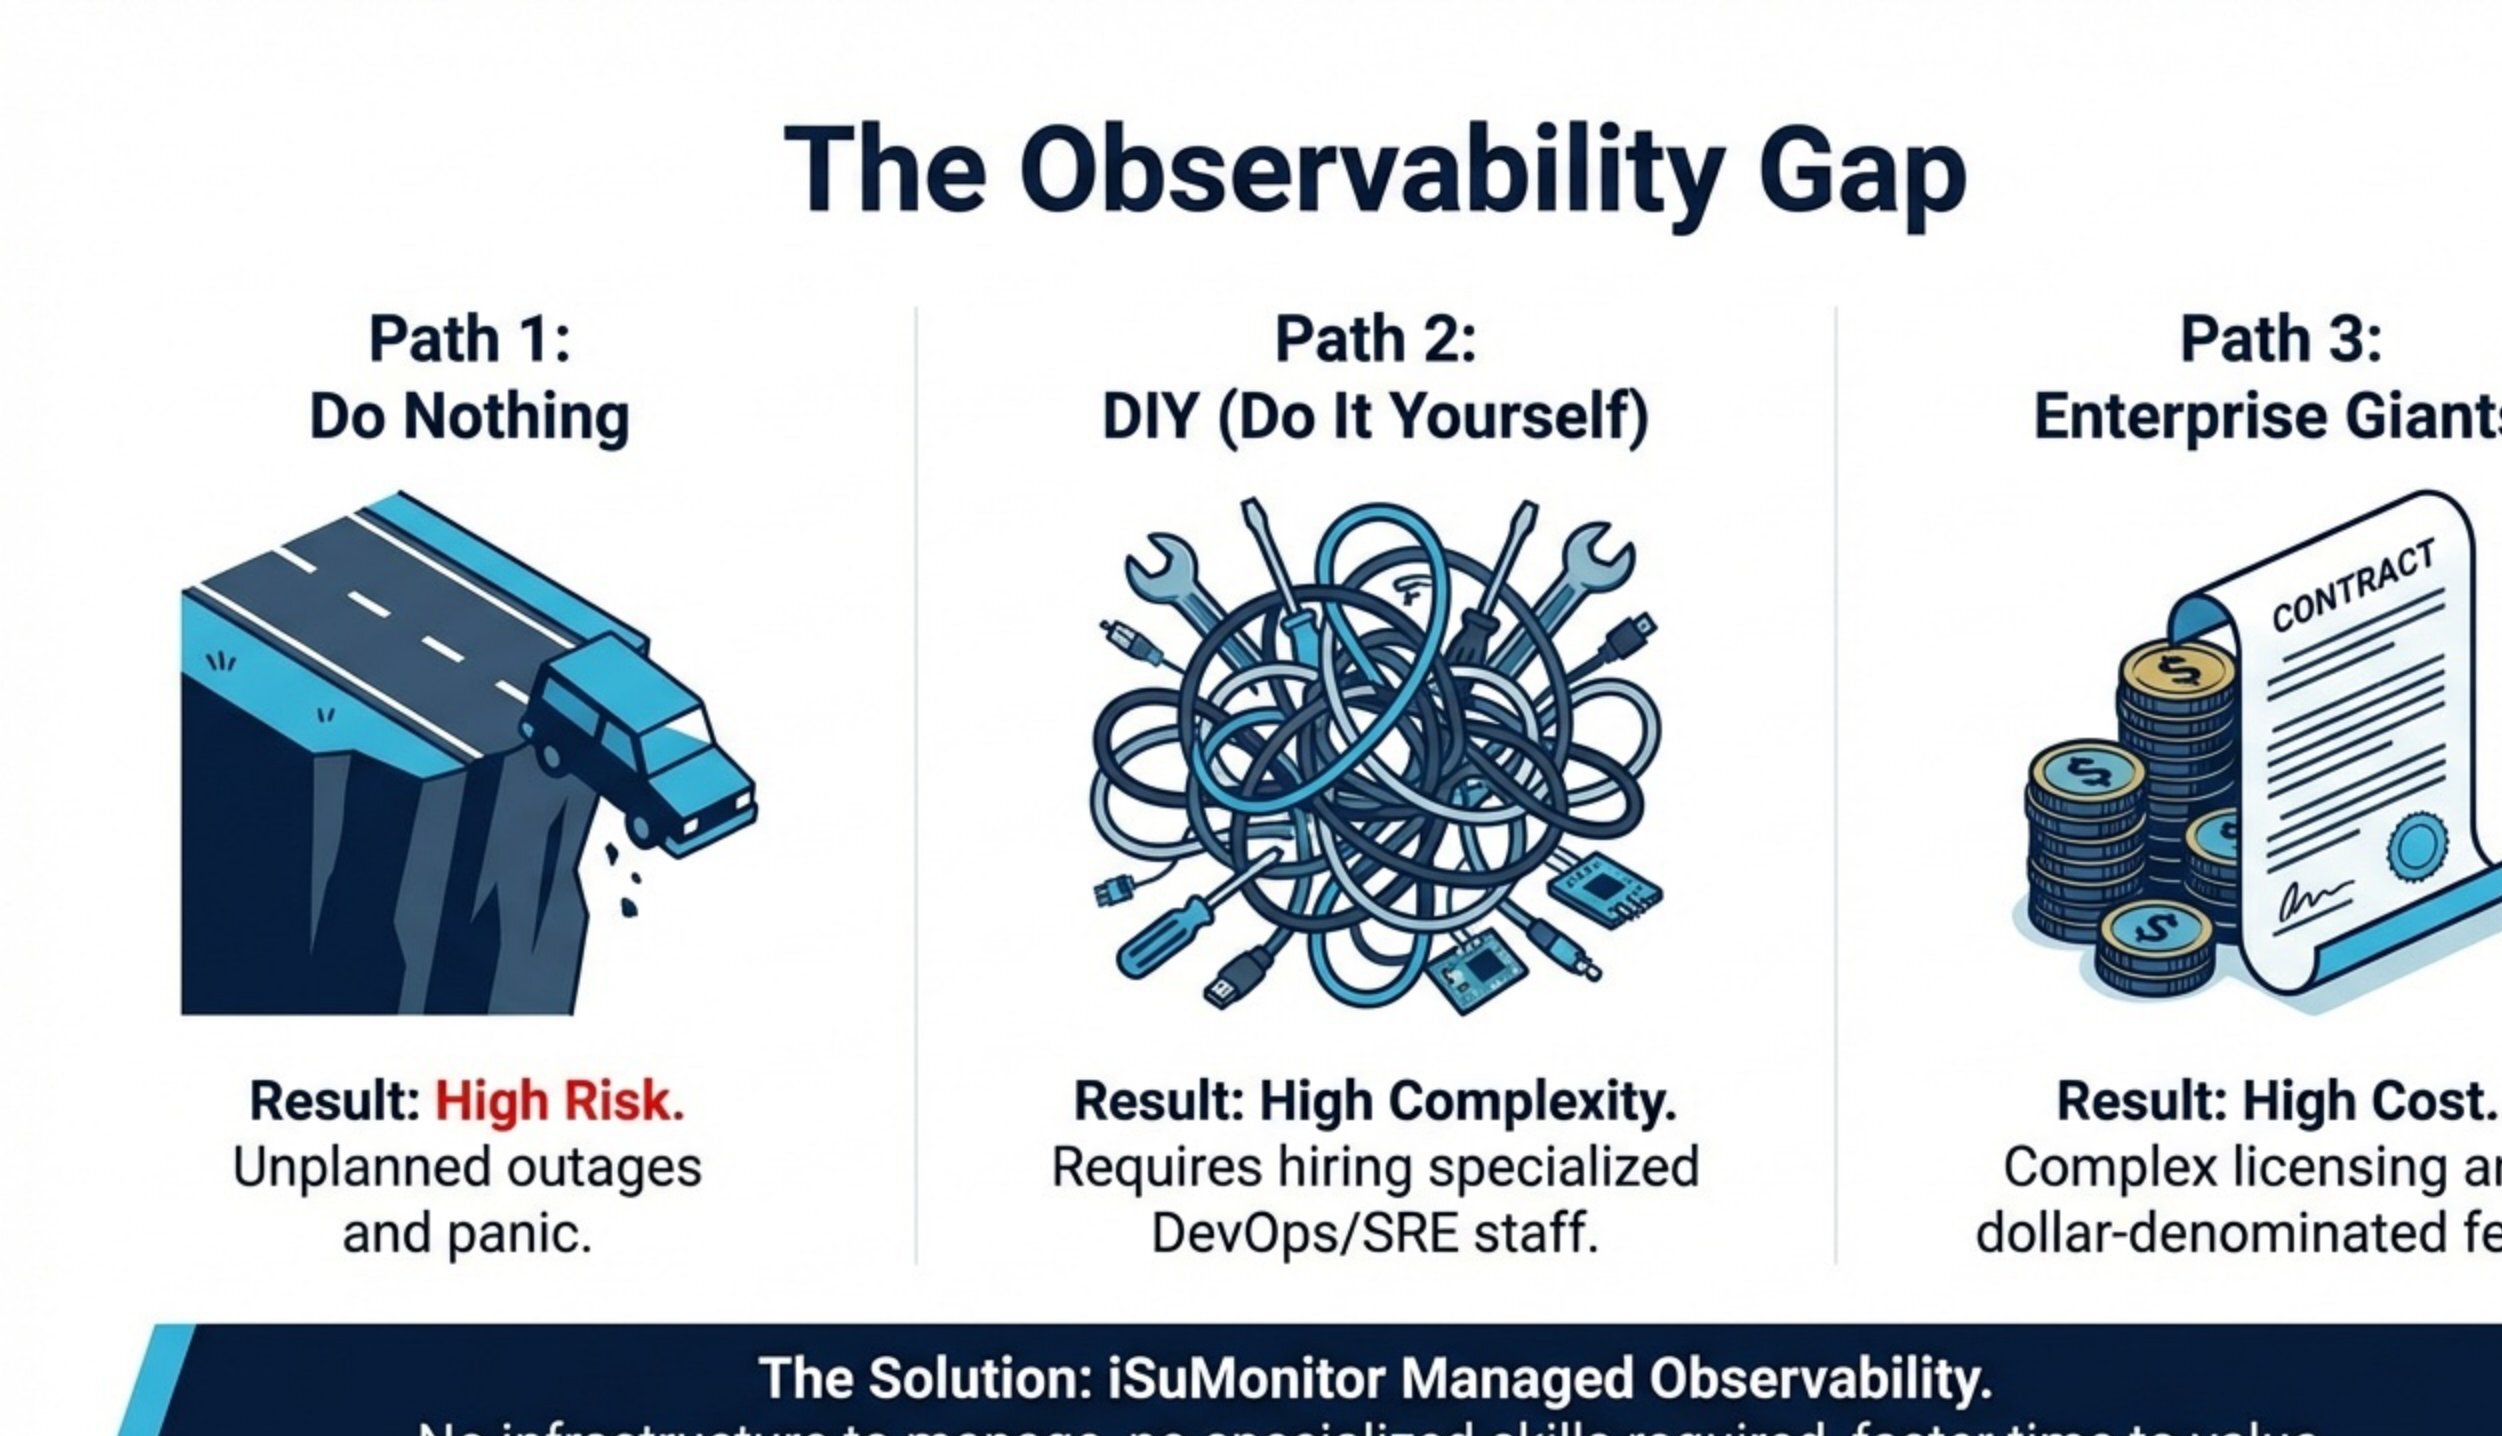
The Observability Gap
Modern infrastructure is opaque. Without proper observability, performance issues and security attempts happen in the dark. Organizations face three paths: do nothing (high risk), build it yourself (high complexity), or use expensive enterprise solutions (high cost). None are ideal.
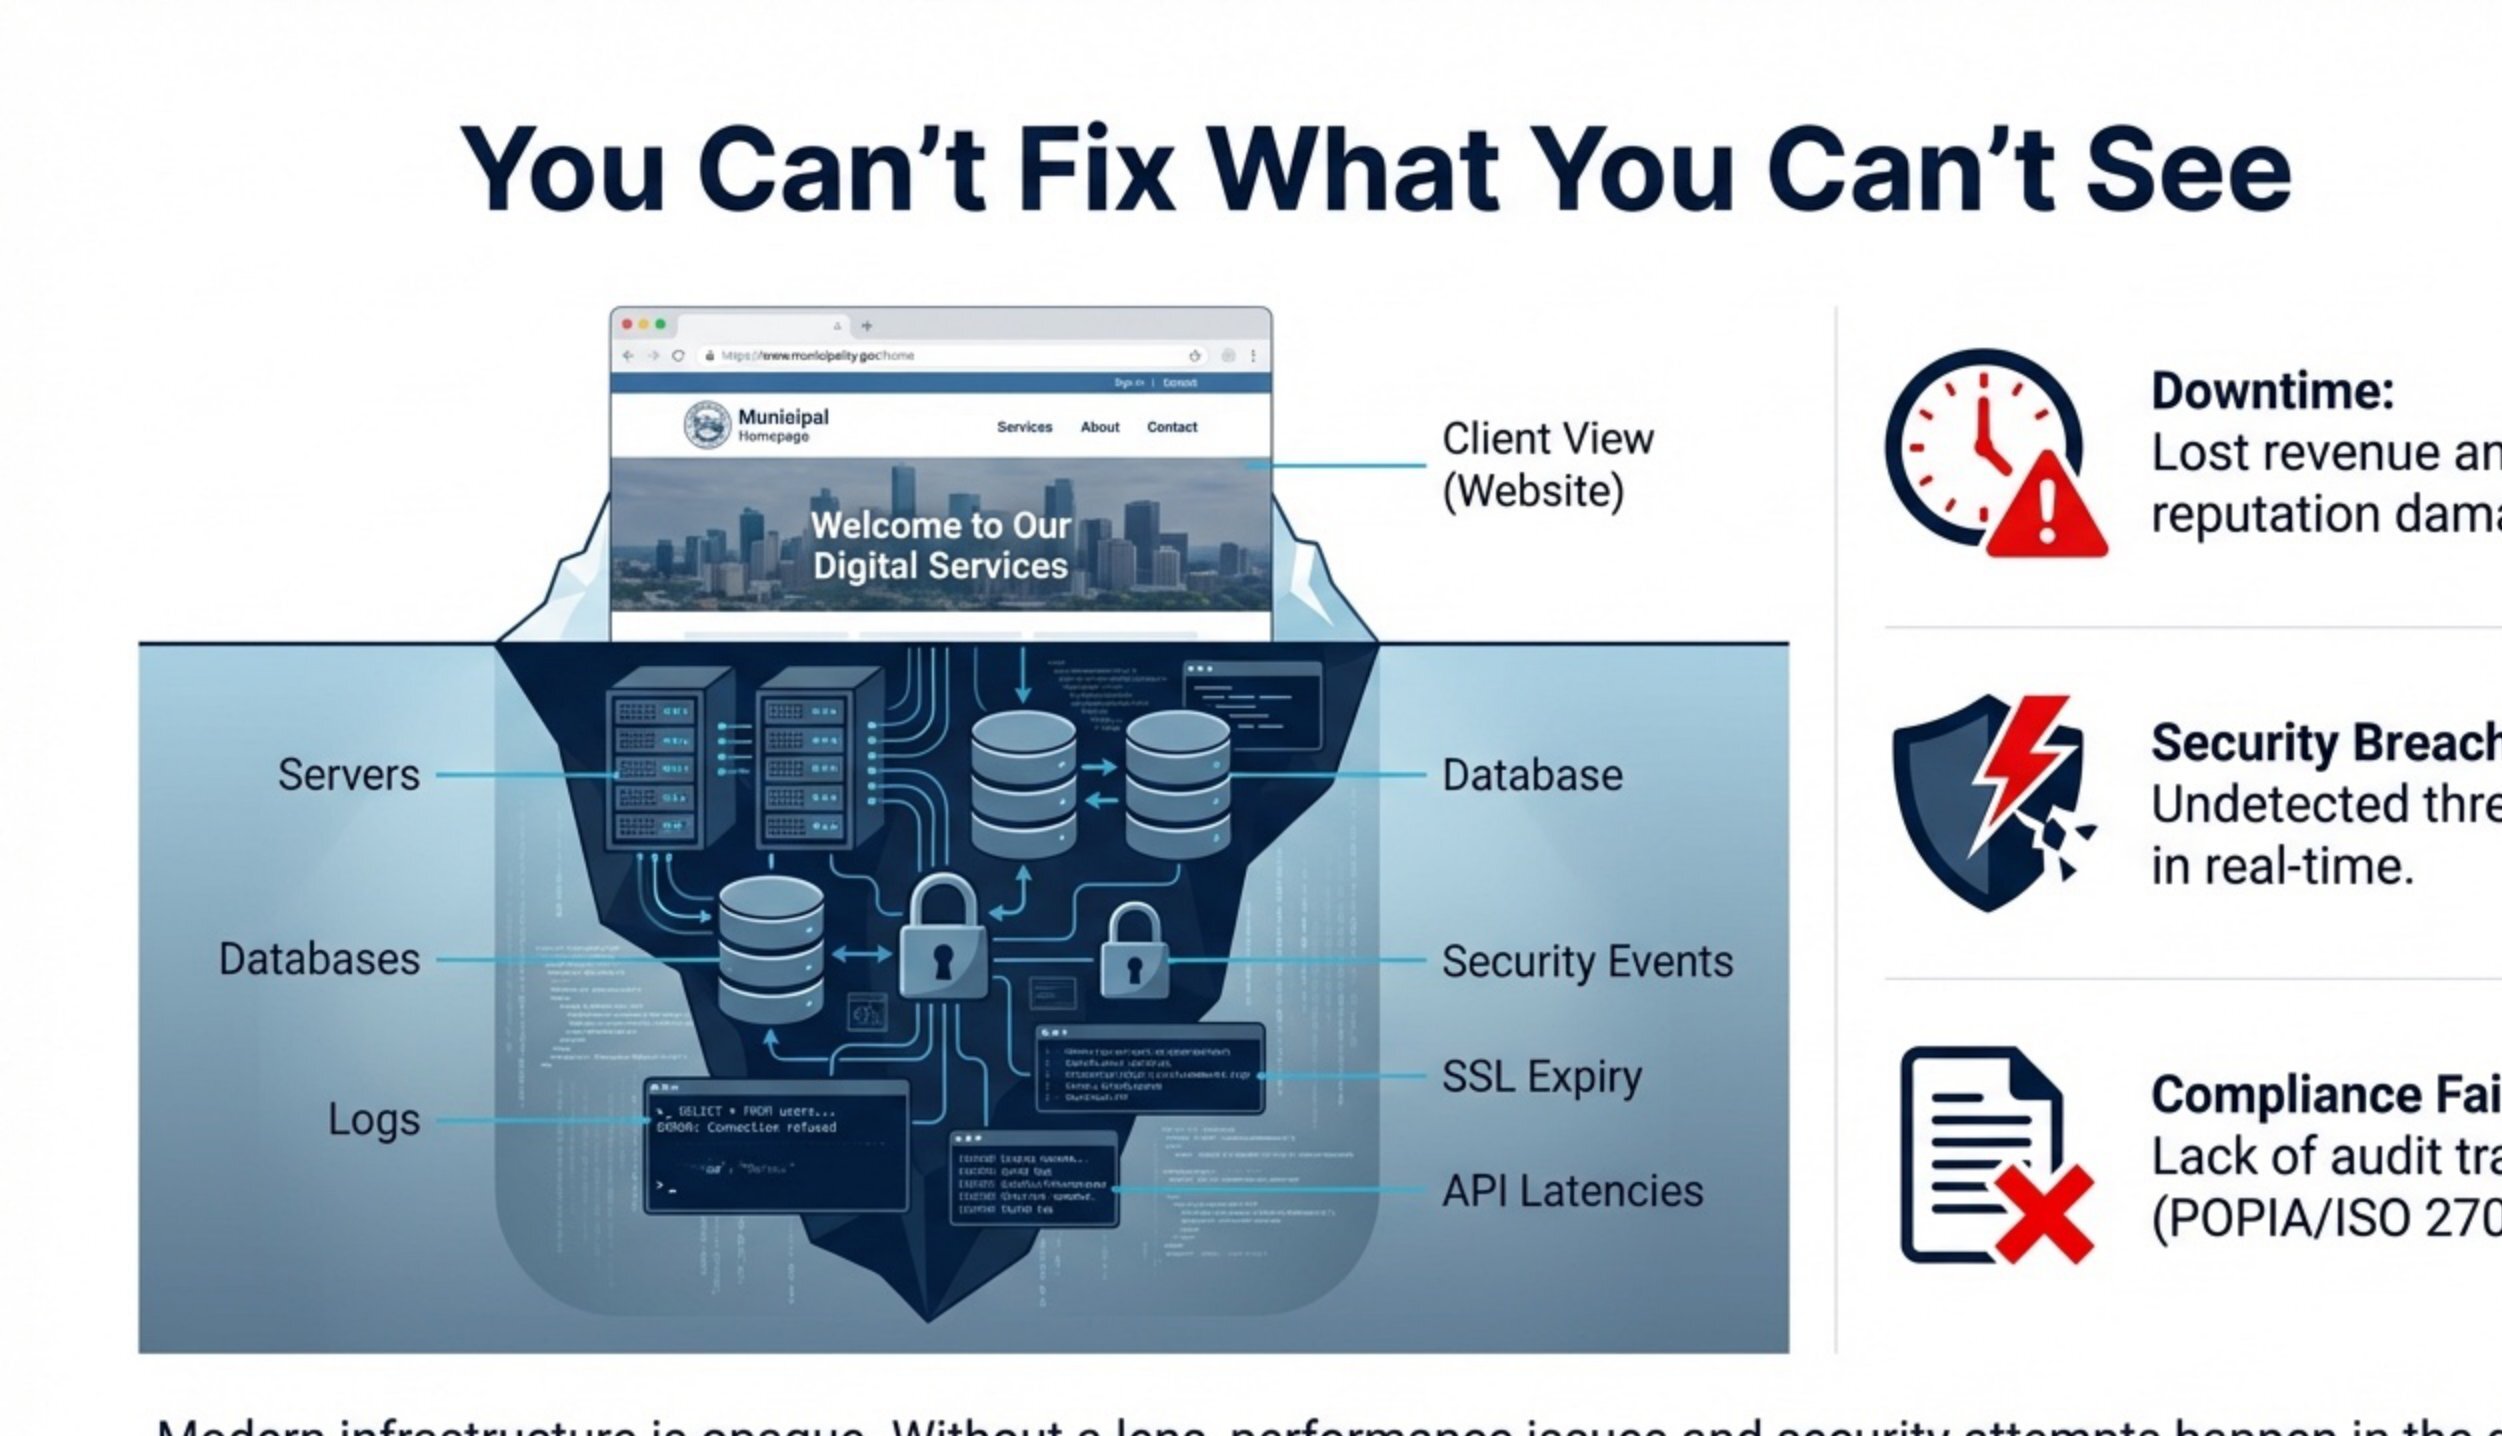
The Core Problem: "You Can't Fix What You Can't See"
Traditional monitoring approaches leave critical blind spots in infrastructure visibility, leading to undetected downtime, security breaches, and compliance failures.
Critical Blind Spots
- Downtime: Lost revenue and reputation damage from undetected outages
- Security Breaches: Undetected threats operating in real-time without alerts
- Compliance Failure: Missing audit trails required for POPIA and ISO 27001
- Performance Issues: SSL expiry, API latencies, and database problems discovered by customers first
- Manual Monitoring: Hours or days to detect issues instead of minutes
The Solution: iSuMonitor Managed Observability
iSuMonitor is a fully managed PLGT (Prometheus, Loki, Grafana, Tempo) observability service that provides businesses with complete visibility into their digital infrastructure, applications, and security posture. No infrastructure to manage, no specialized skills required, faster time to value.
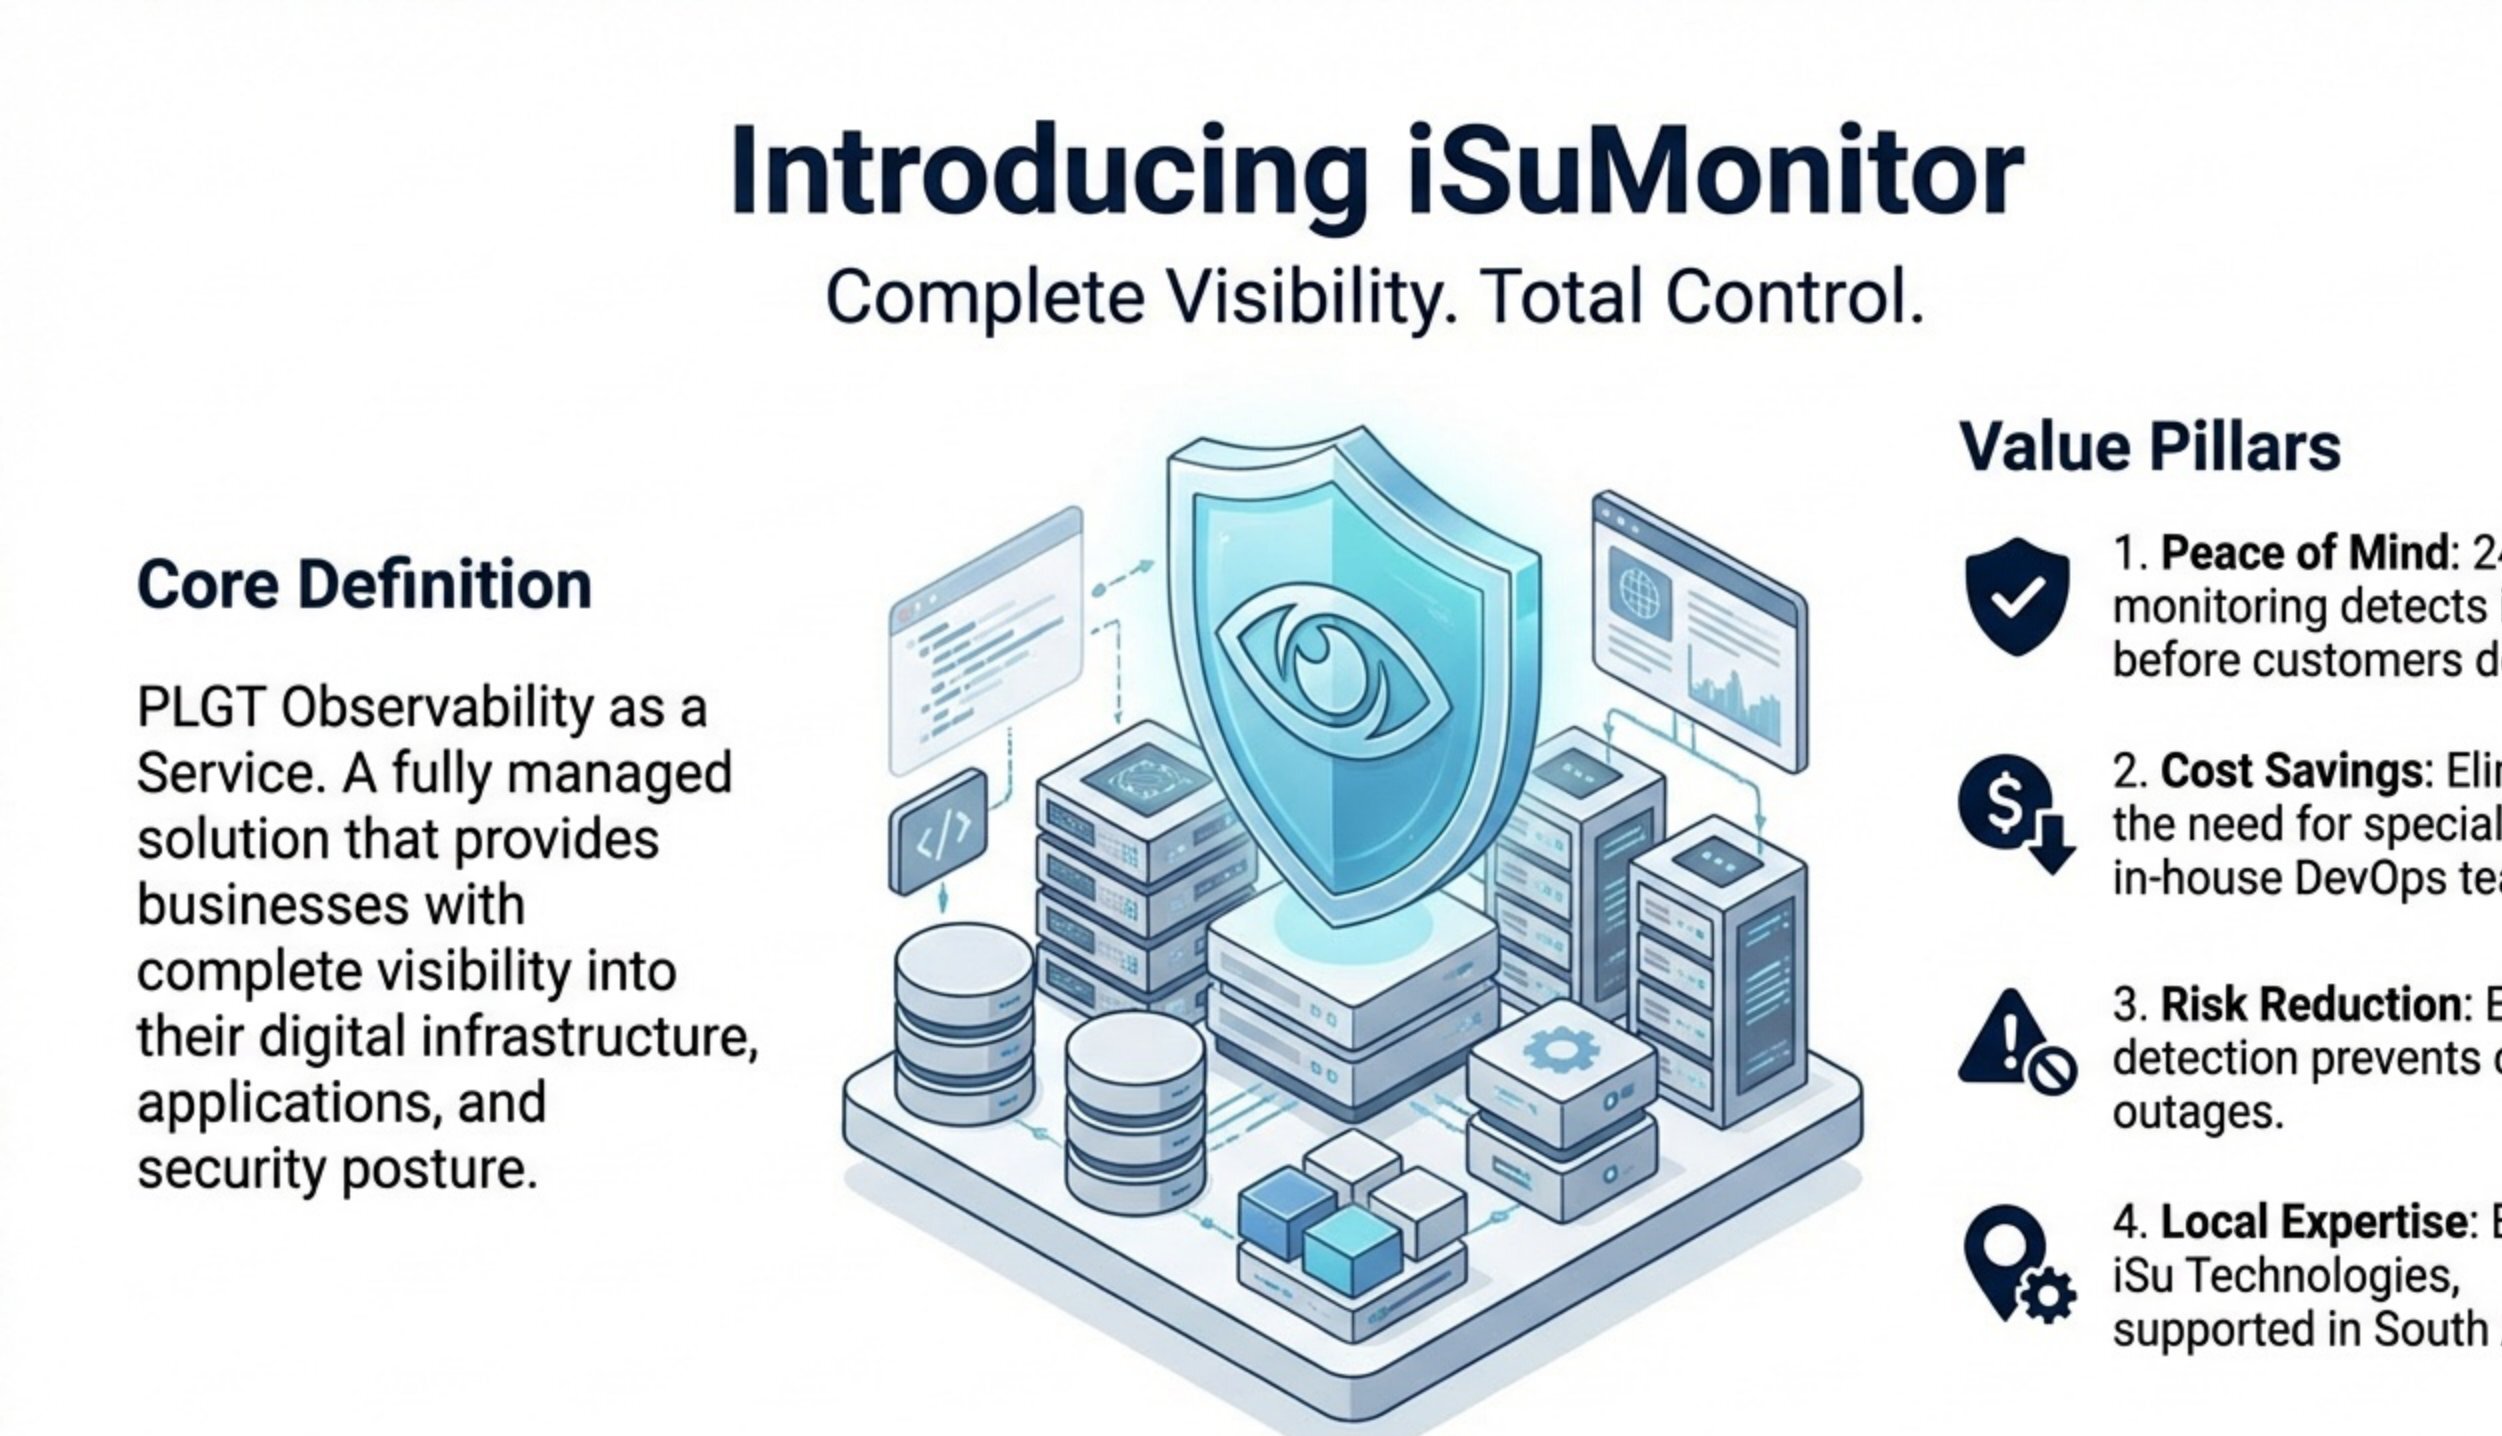
Complete Visibility, Total Control
We deliver enterprise-grade observability as a service, combining the power of the industry-standard PLGT stack with expert configuration and ongoing maintenance—all included, not as an upsell.
1. Peace of Mind
24/7 monitoring detects issues before customers do. Proactive alerts mean you know about problems before they impact operations.
2. Cost Savings
Eliminate the need for specialized in-house DevOps teams. Low, local currency pricing without hidden staff costs.
3. Risk Reduction
Early detection prevents costly outages. Automated security monitoring catches attacks in progress.
4. Local Expertise
Built by iSu Technologies, supported in South Africa. Local support, no international ticket systems.
Beyond Monitoring: True Observability
iSuMonitor provides the complete PLGT stack delivering four pillars of observability. We don't just tell you the site is down—we tell you why, where, and how to fix it.
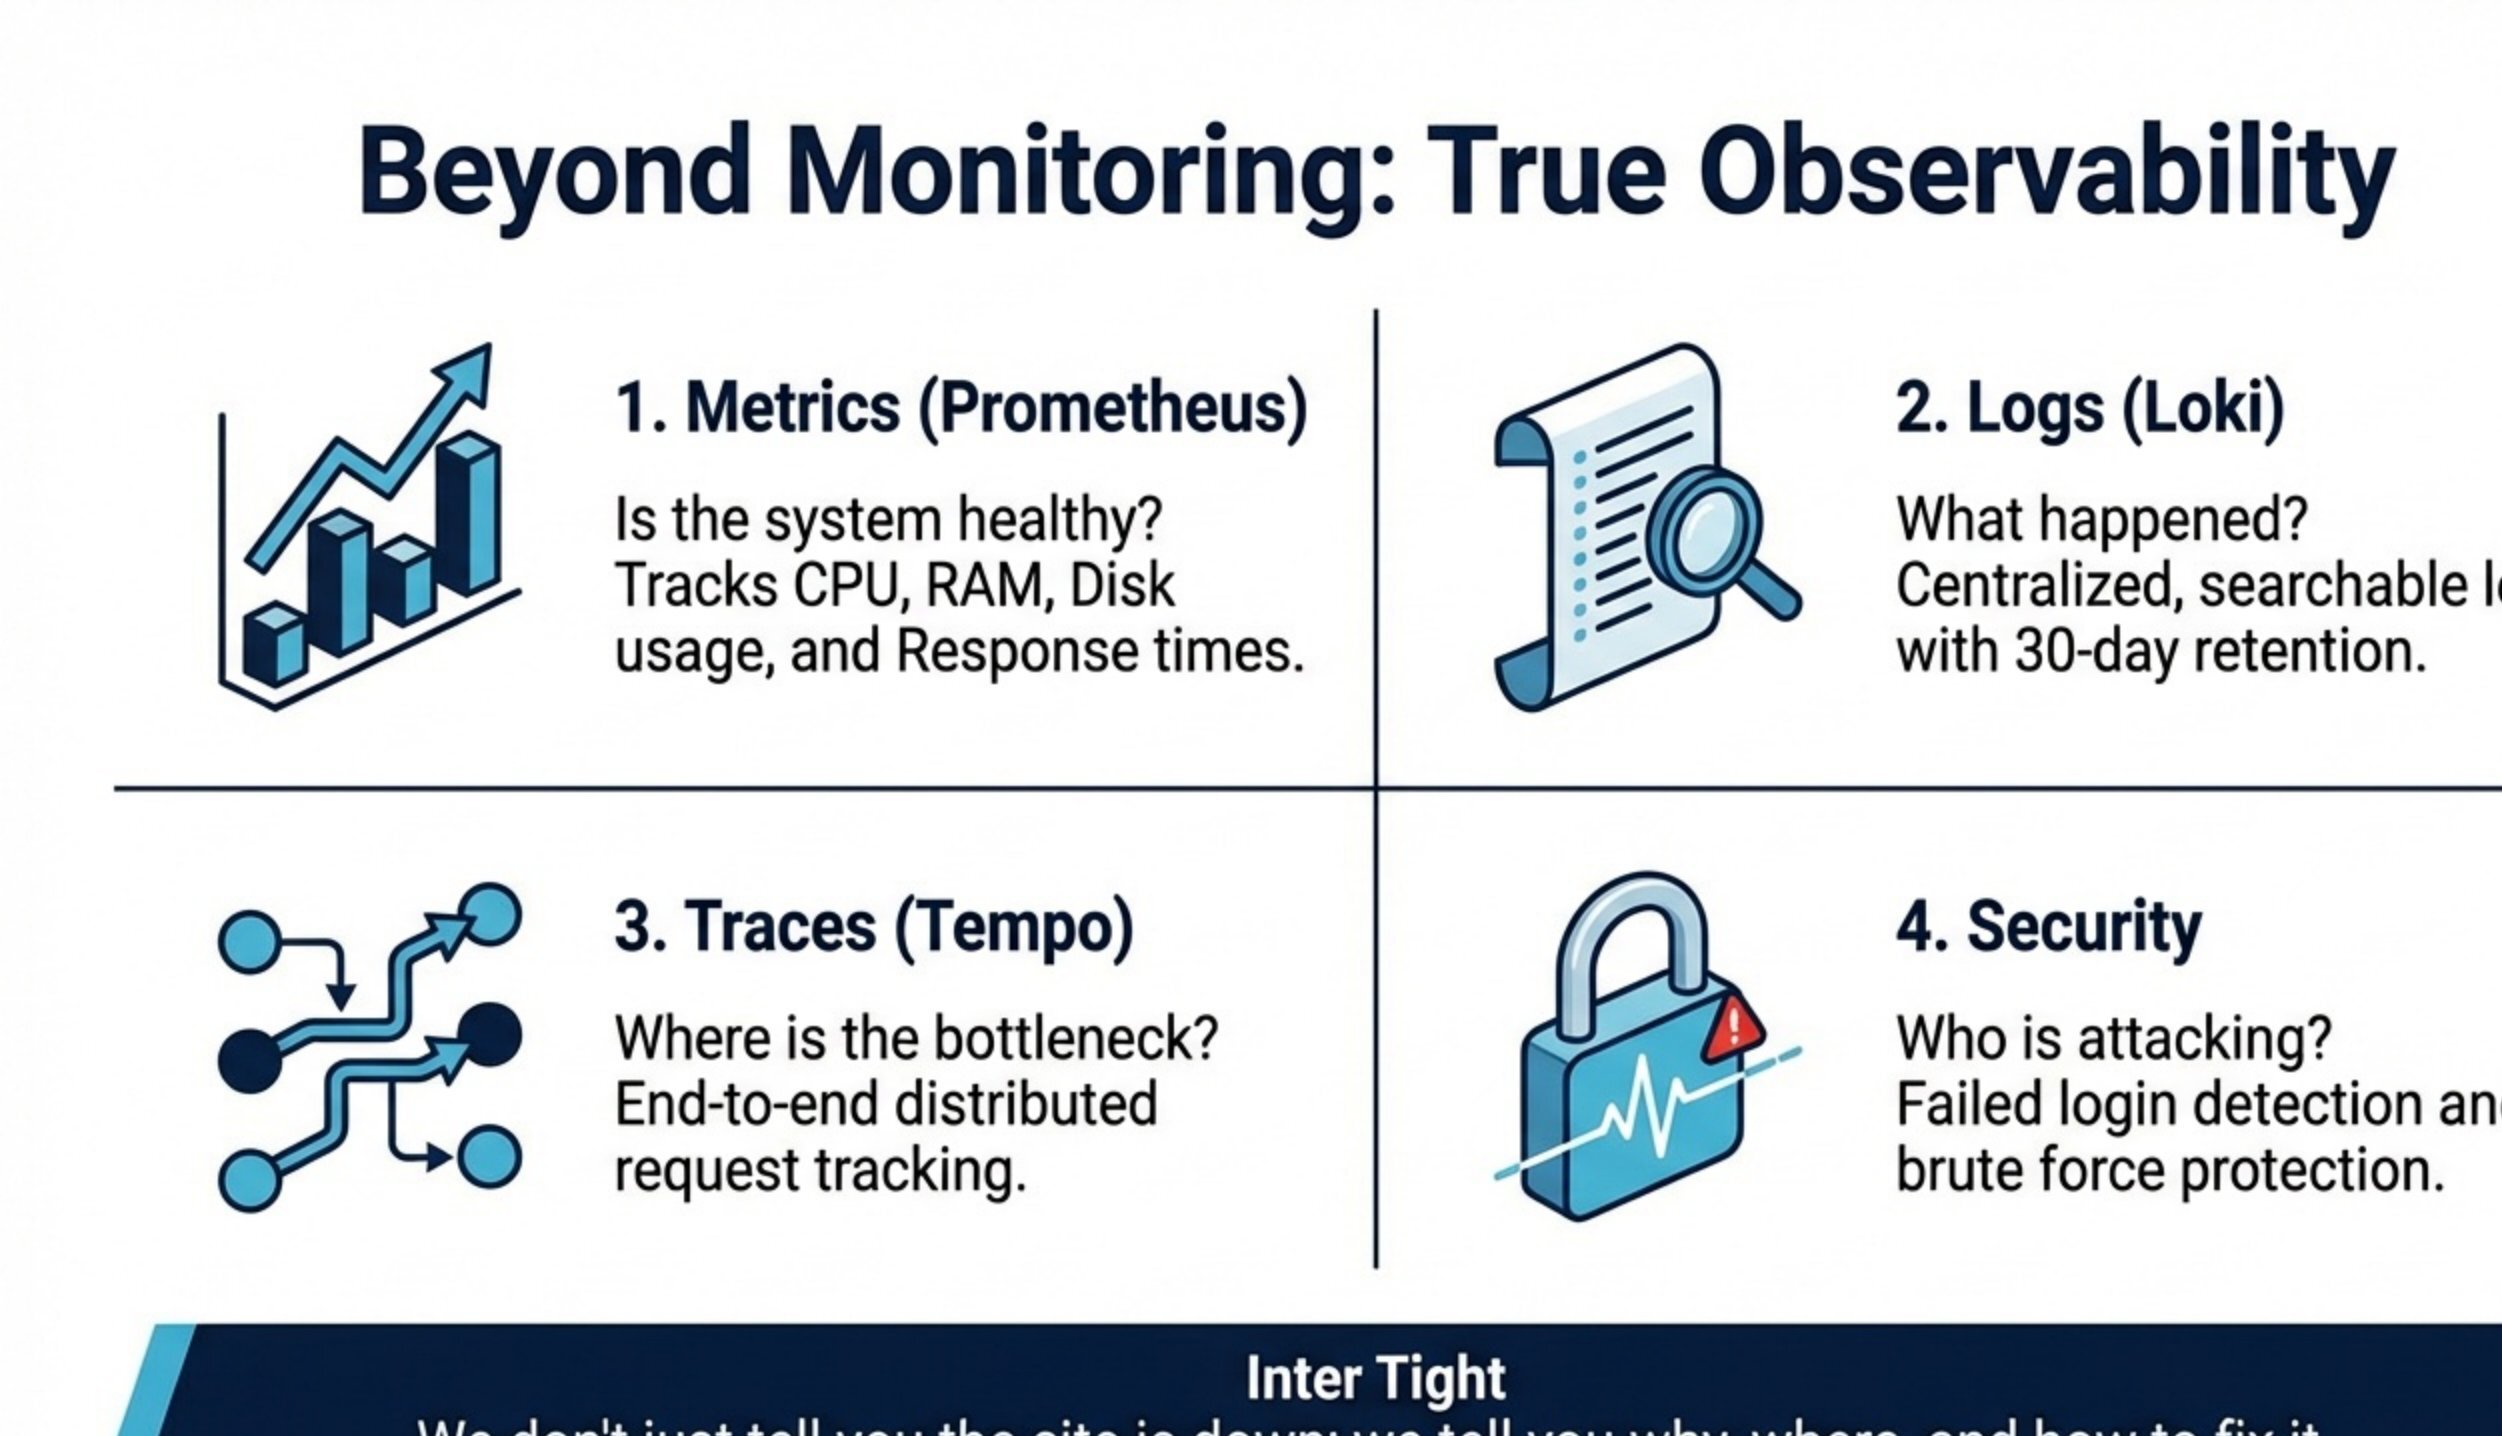
1. Metrics (Prometheus)
- Is the system healthy?
- CPU, RAM, Disk usage tracking
- Response time monitoring
- Real-time performance graphs
2. Logs (Loki)
- What happened?
- Centralized, searchable logs
- 30-day log retention
- Correlate logs with metrics
3. Traces (Tempo)
- Where is the bottleneck?
- End-to-end distributed tracing
- Request flow visualization
- Performance optimization
4. Security Monitoring
- Who is attacking?
- Failed login detection
- Brute force protection
- Real-time threat alerts
Unified Visibility Dashboard
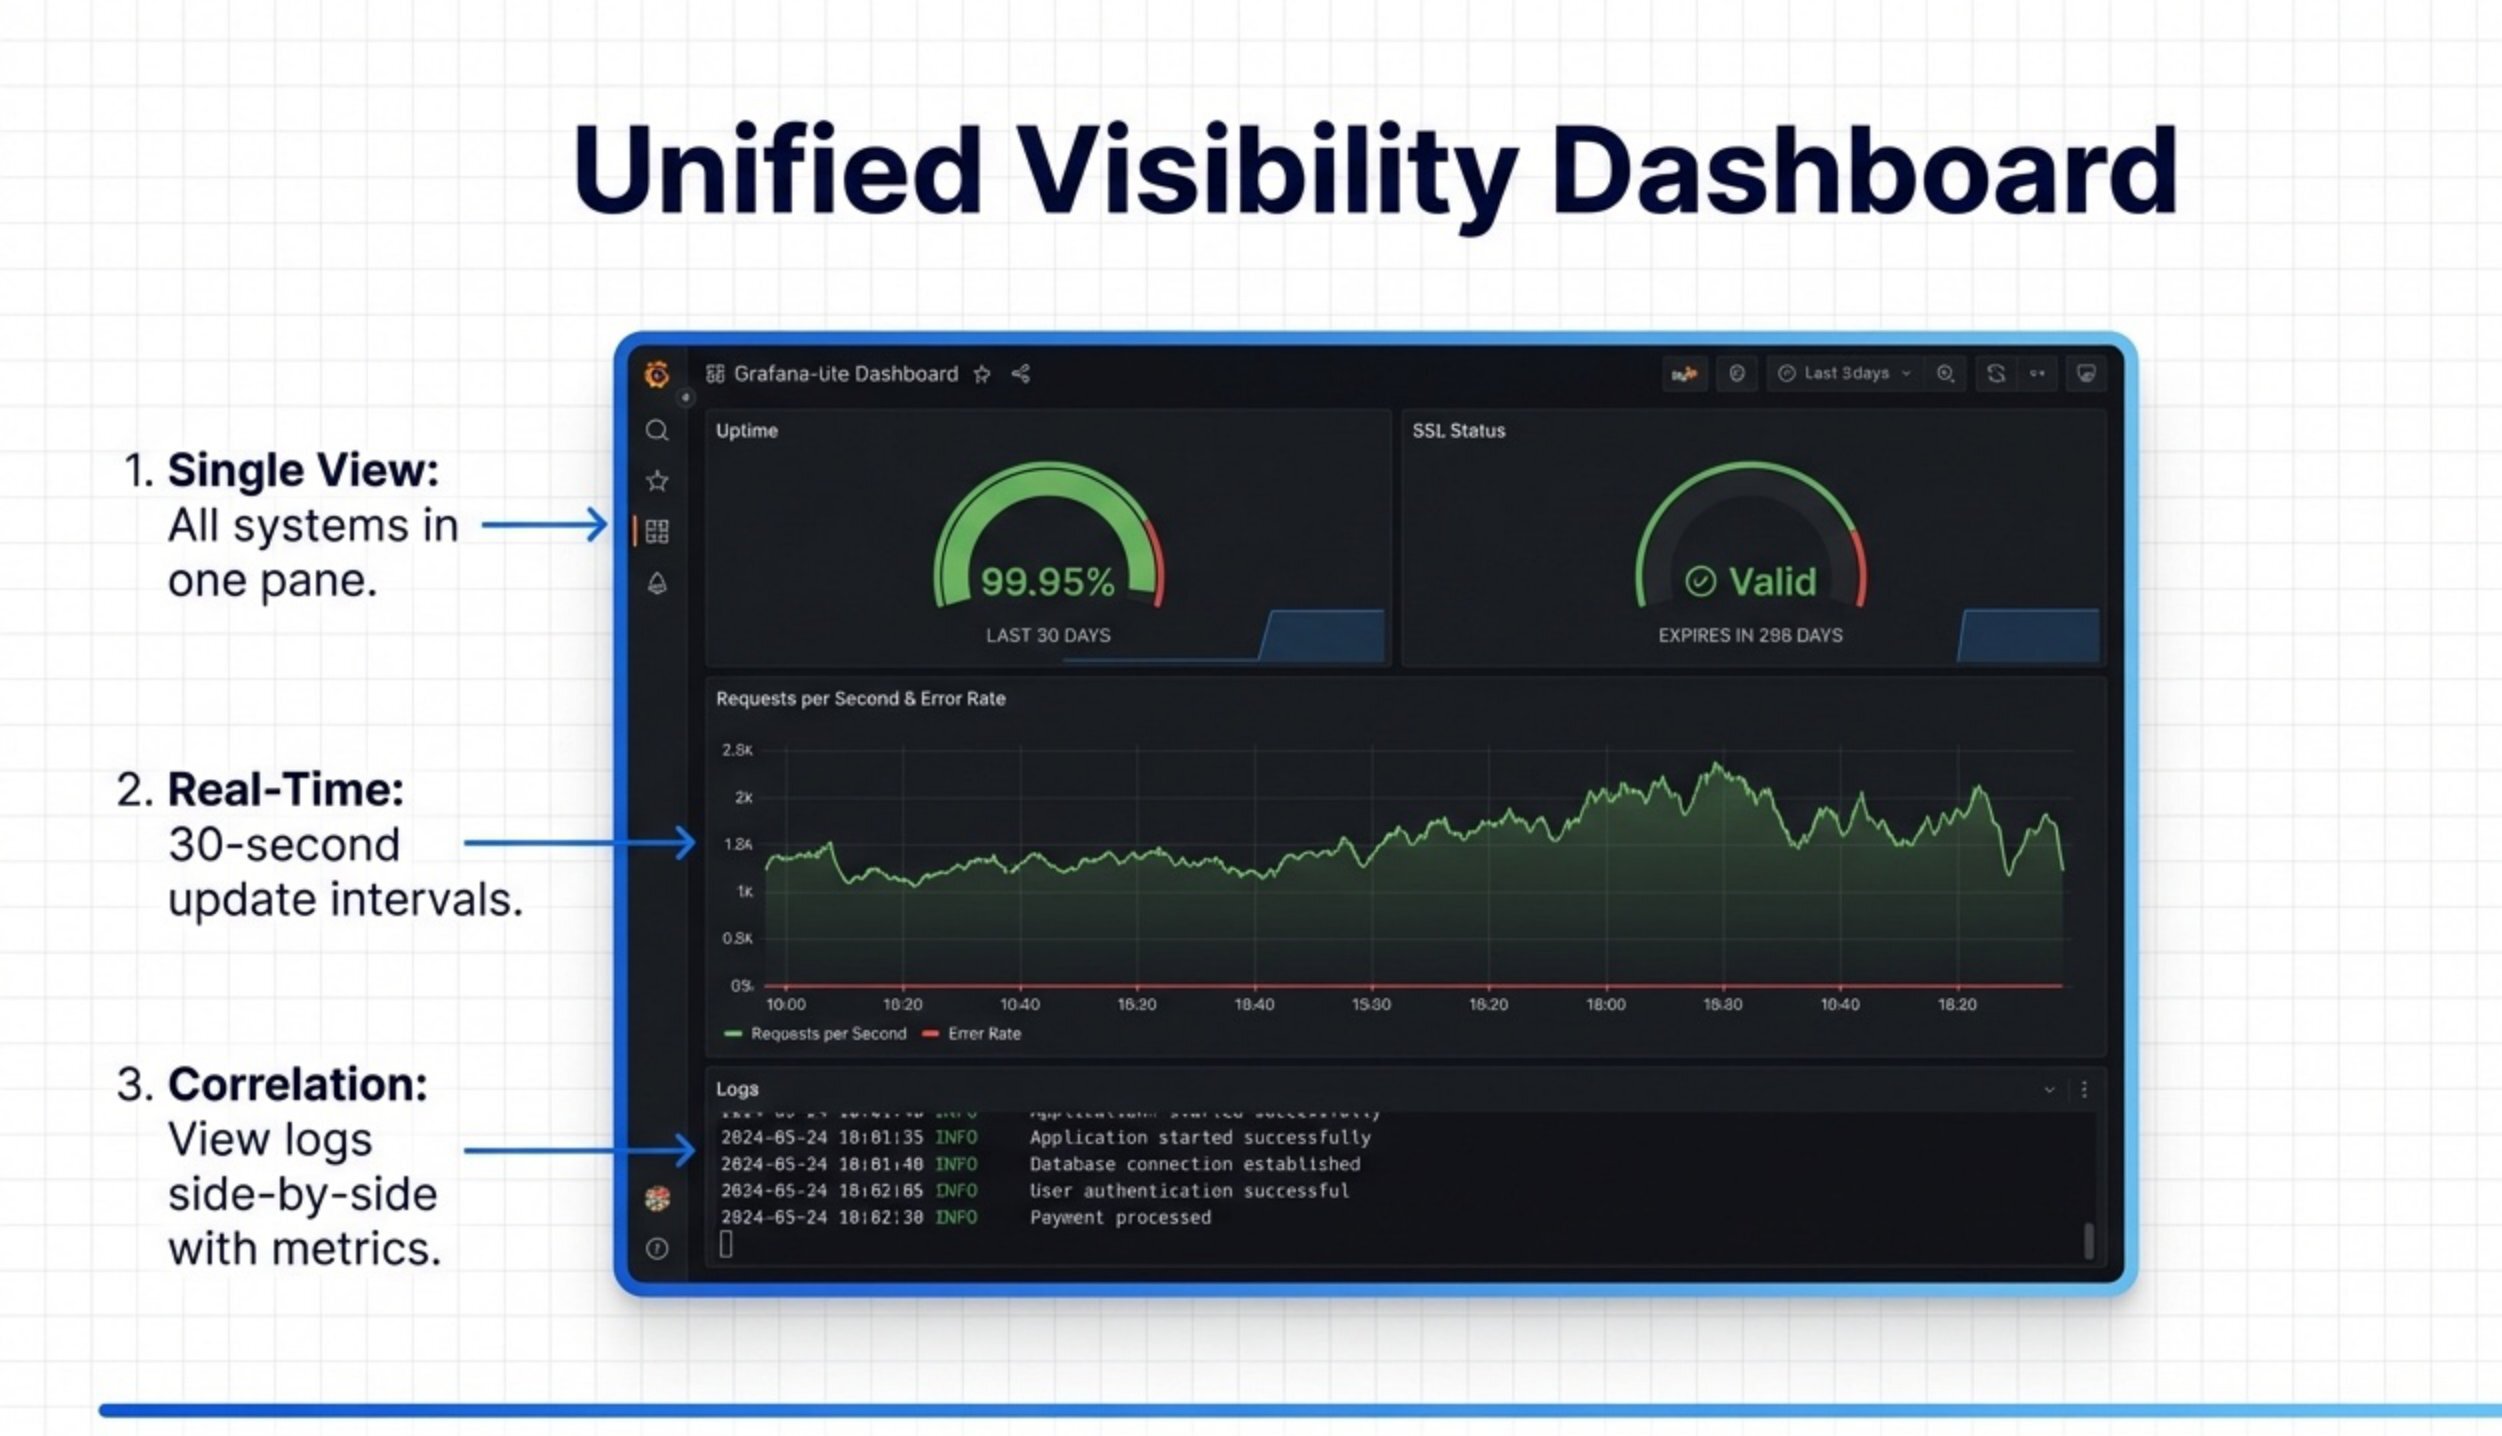
- Single View: All systems monitored in one unified dashboard
- Real-Time Updates: 30-second refresh intervals for live monitoring
- Correlation: View logs side-by-side with metrics for instant diagnosis
- Uptime Tracking: Verified 99.9% uptime monitoring with historical data
- SSL Monitoring: Automatic certificate expiry tracking and alerts
Intelligent Multi-Channel Alerting
No more manual checking. If it breaks, you'll know instantly through your preferred communication channel.
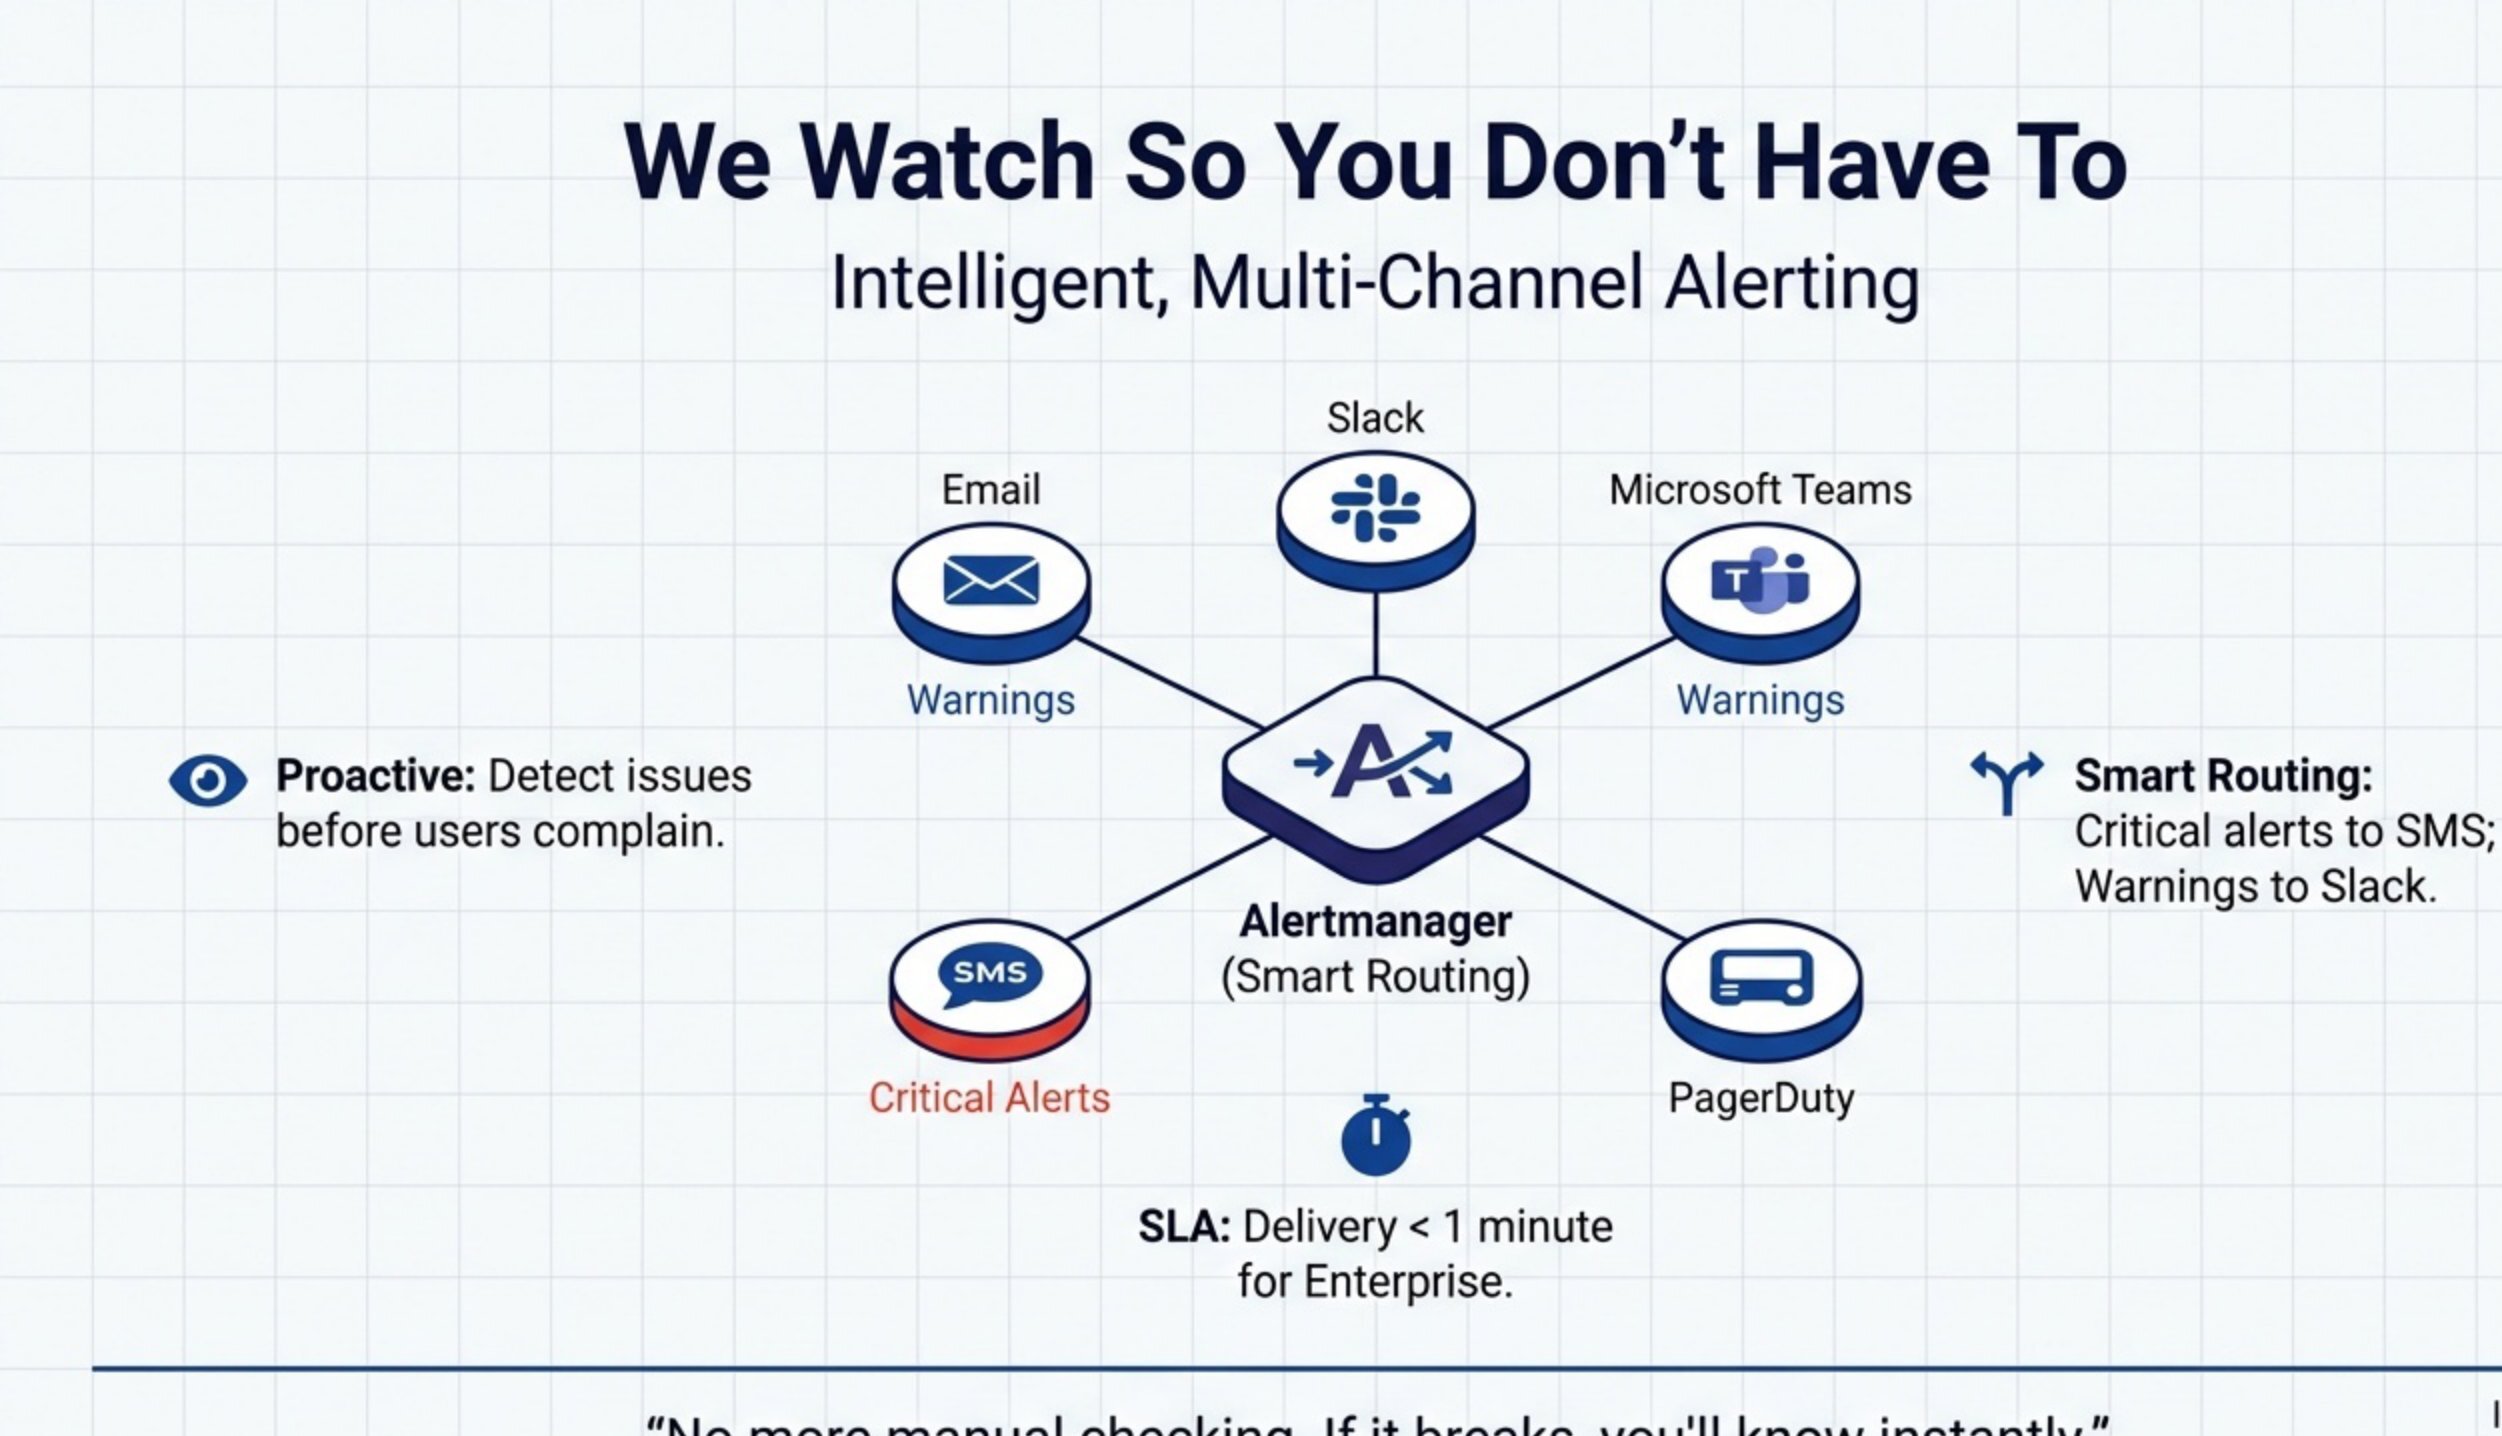
Alertmanager with Smart Routing
- Email Alerts: Detailed warnings with context and resolution steps
- Slack Integration: Team notifications for warnings and issues
- Microsoft Teams: Enterprise communication channel support
- SMS for Critical Alerts: Immediate notification for urgent issues
- PagerDuty Integration: Enterprise incident management workflows
- Smart Routing: Critical alerts via SMS, warnings to Slack, priority-based delivery
- SLA Guarantee: Delivery under 1 minute for Enterprise tier
Proactive vs. Reactive
Traditional monitoring is reactive—you discover issues when customers complain. iSuMonitor is proactive—detecting issues before users complain, preventing revenue loss and reputation damage.
Technical Stack & Infrastructure
Powered by the industry-standard PLGT stack, hosted on enterprise-grade cloud infrastructure with daily configuration backups and TLS 1.3 encryption.
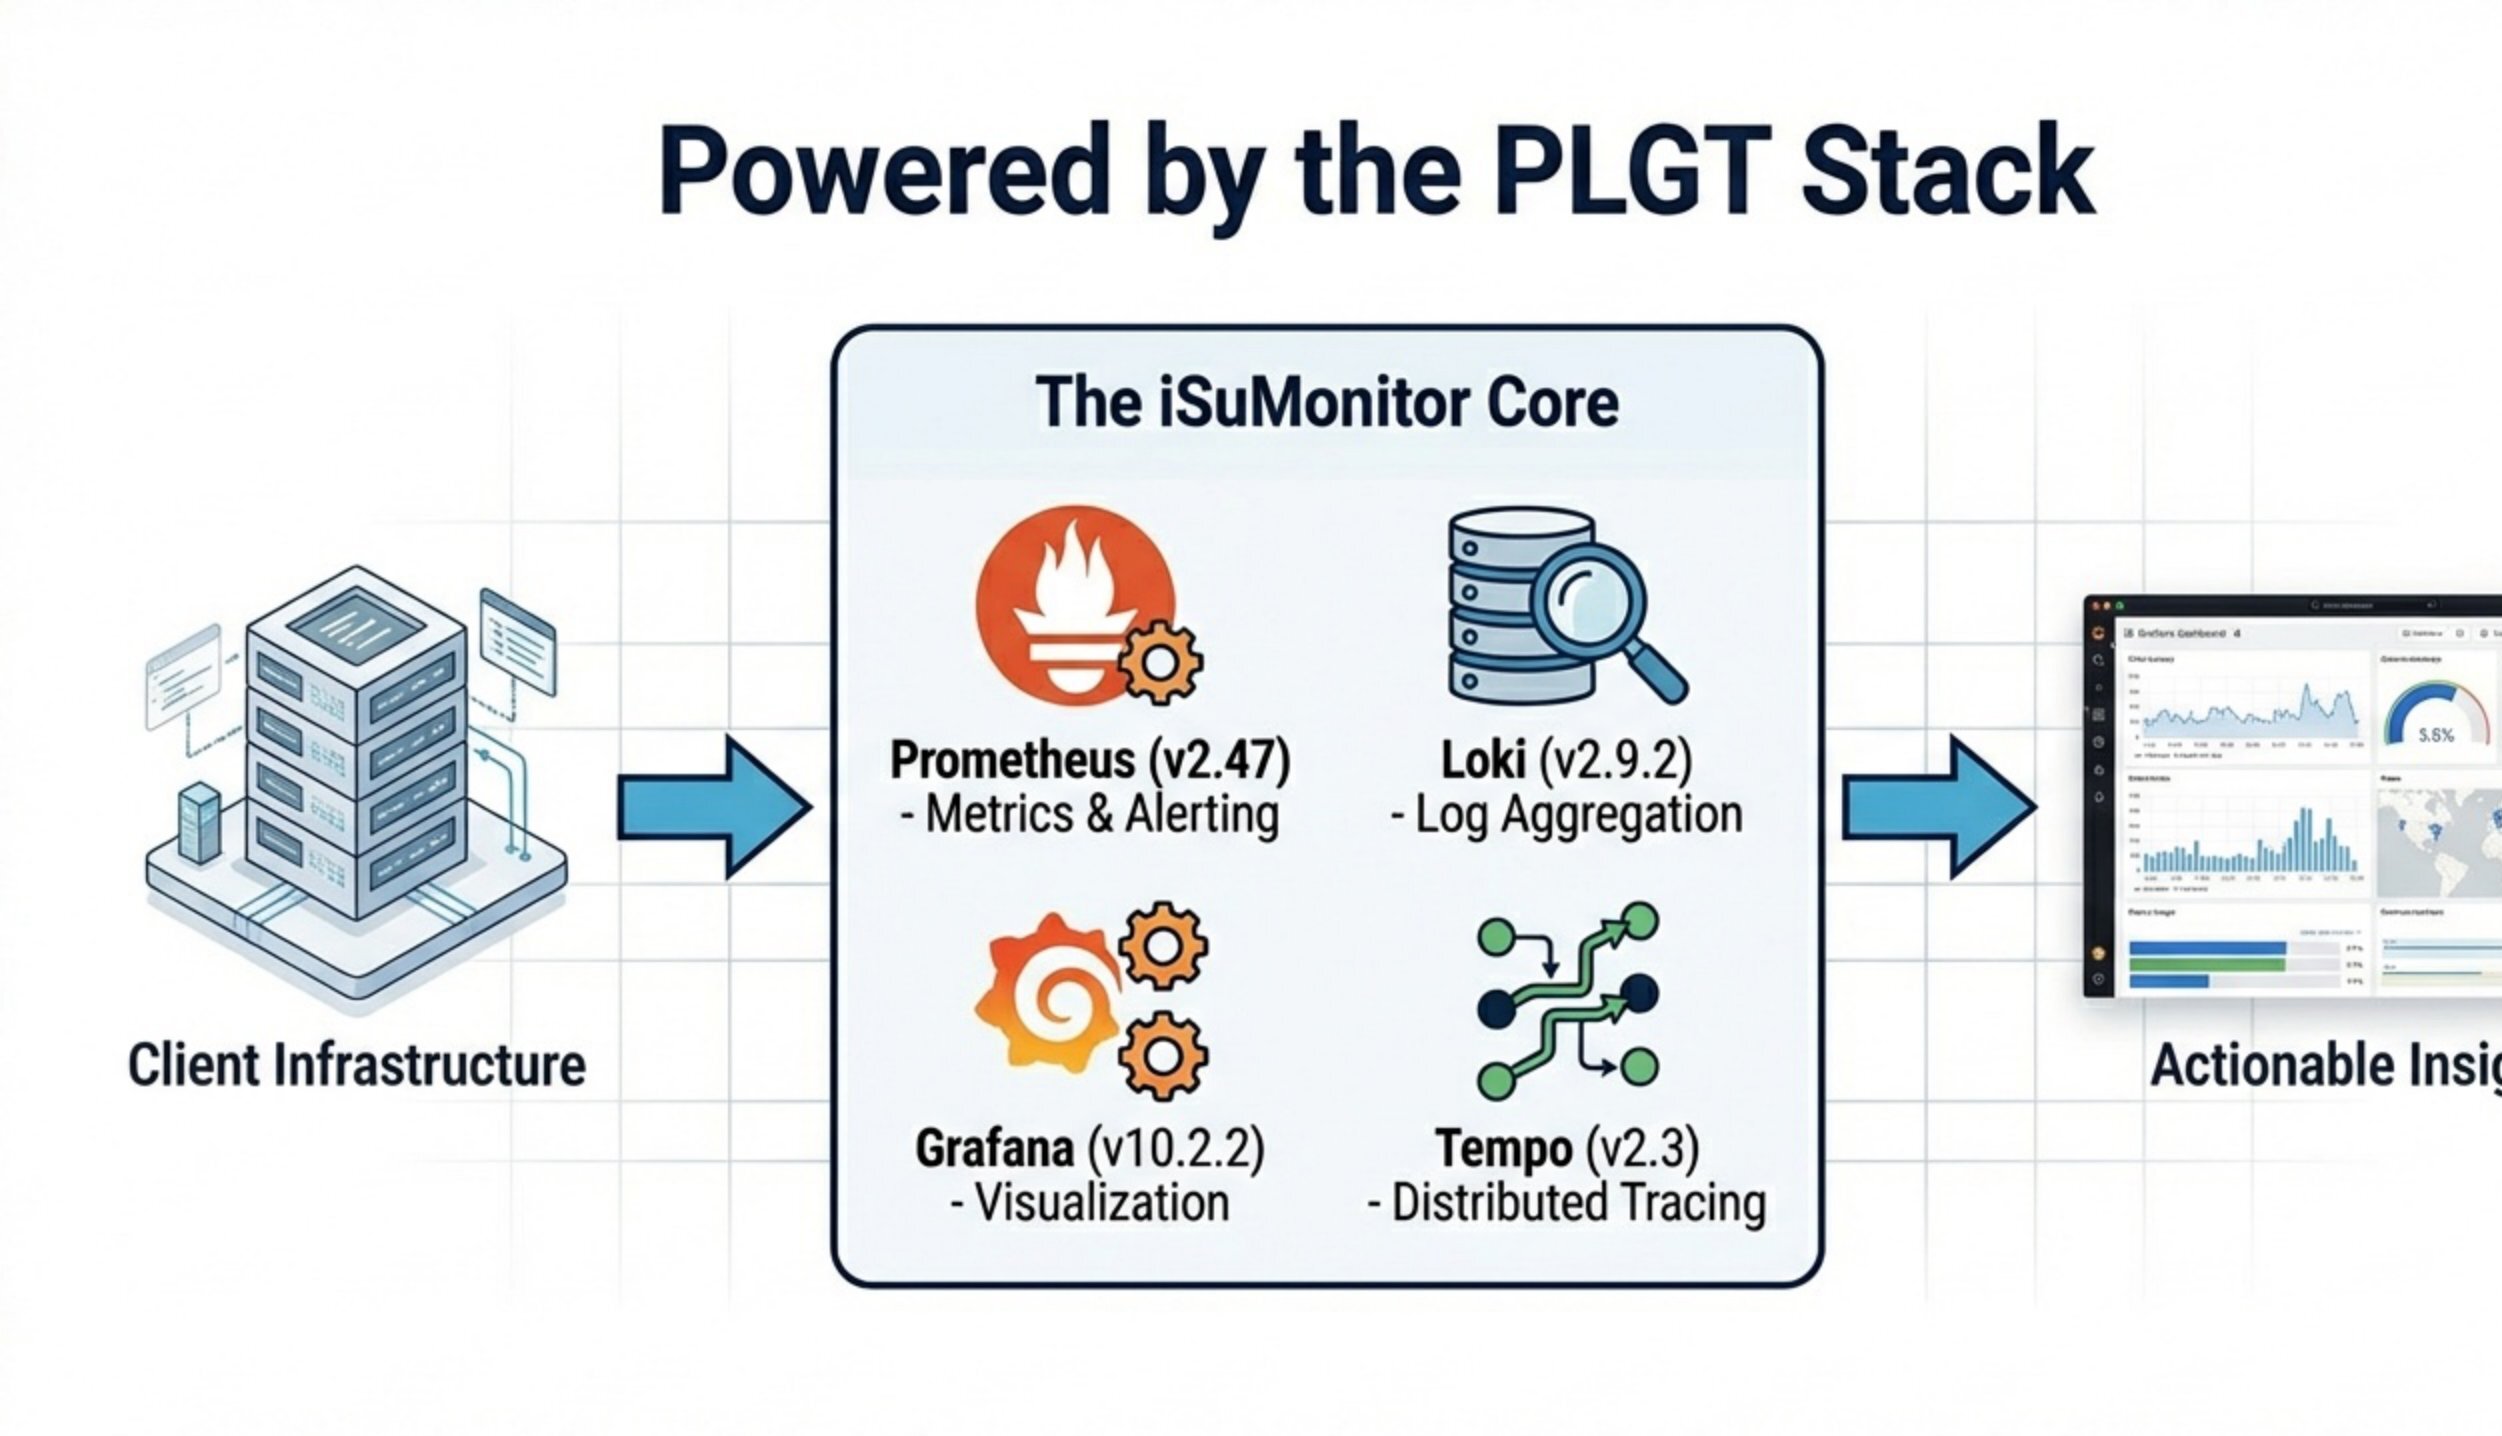
The iSuMonitor Core
- Prometheus v2.47 (Metrics & Alerting)
- Loki v2.9.2 (Log Aggregation)
- Grafana v10.2.2 (Visualization)
- Tempo v2.3 (Distributed Tracing)
Integration Tools
- Blackbox Probes (HTTP/HTTPS & SSL monitoring)
- PHP Metrics Exporter (Shared hosting support)
- Log Shipper (Database & app log sync)
- OTLP Integration (Node.js/Python apps)
Infrastructure
- Hosted on Hetzner Cloud, Germany
- Daily configuration backups
- TLS 1.3 encryption
- Enterprise-grade reliability
Tech Stack Support
- PHP applications
- Node.js applications
- Python applications
- MySQL & PostgreSQL databases
Seamless Integration
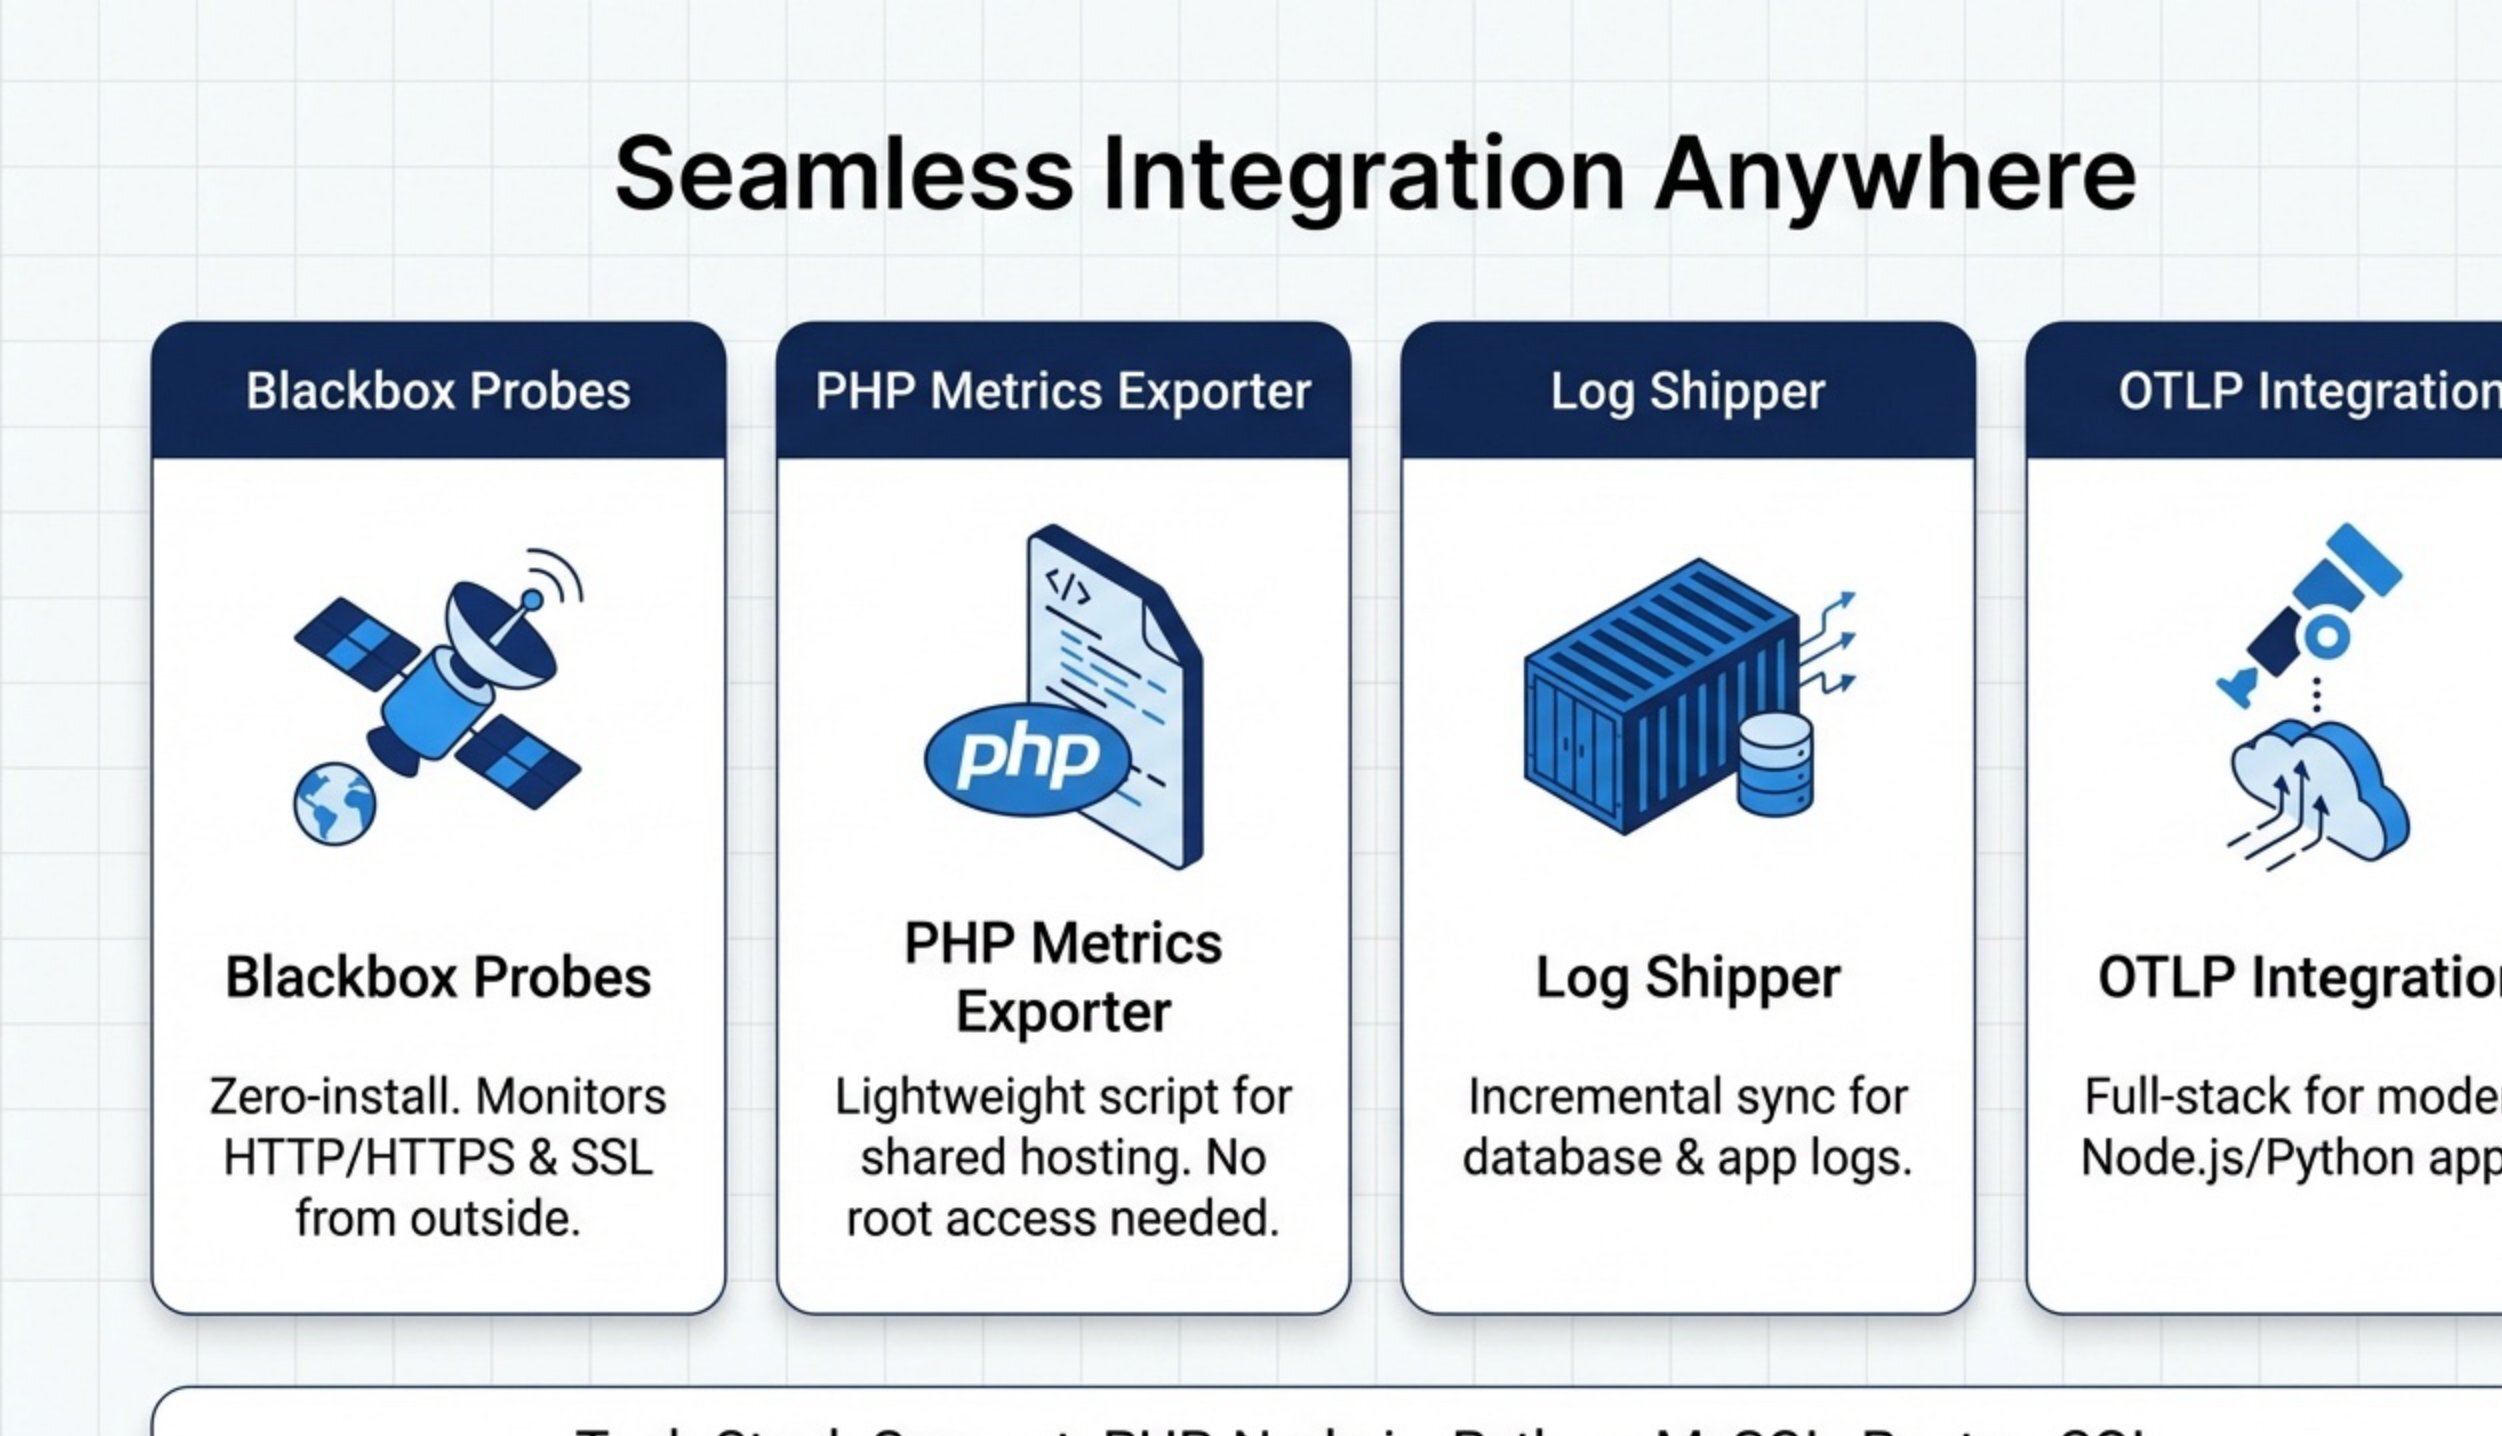
Zero-install monitoring for HTTP/HTTPS endpoints and SSL certificates. Lightweight scripts for shared hosting environments. Full-stack OTLP integration for modern Node.js and Python applications. No root access required for PHP metrics collection.
Vigilance & Security Posture
iSuMonitor provides comprehensive security monitoring with audit trails supporting POPIA, GDPR, and ISO 27001 compliance requirements.
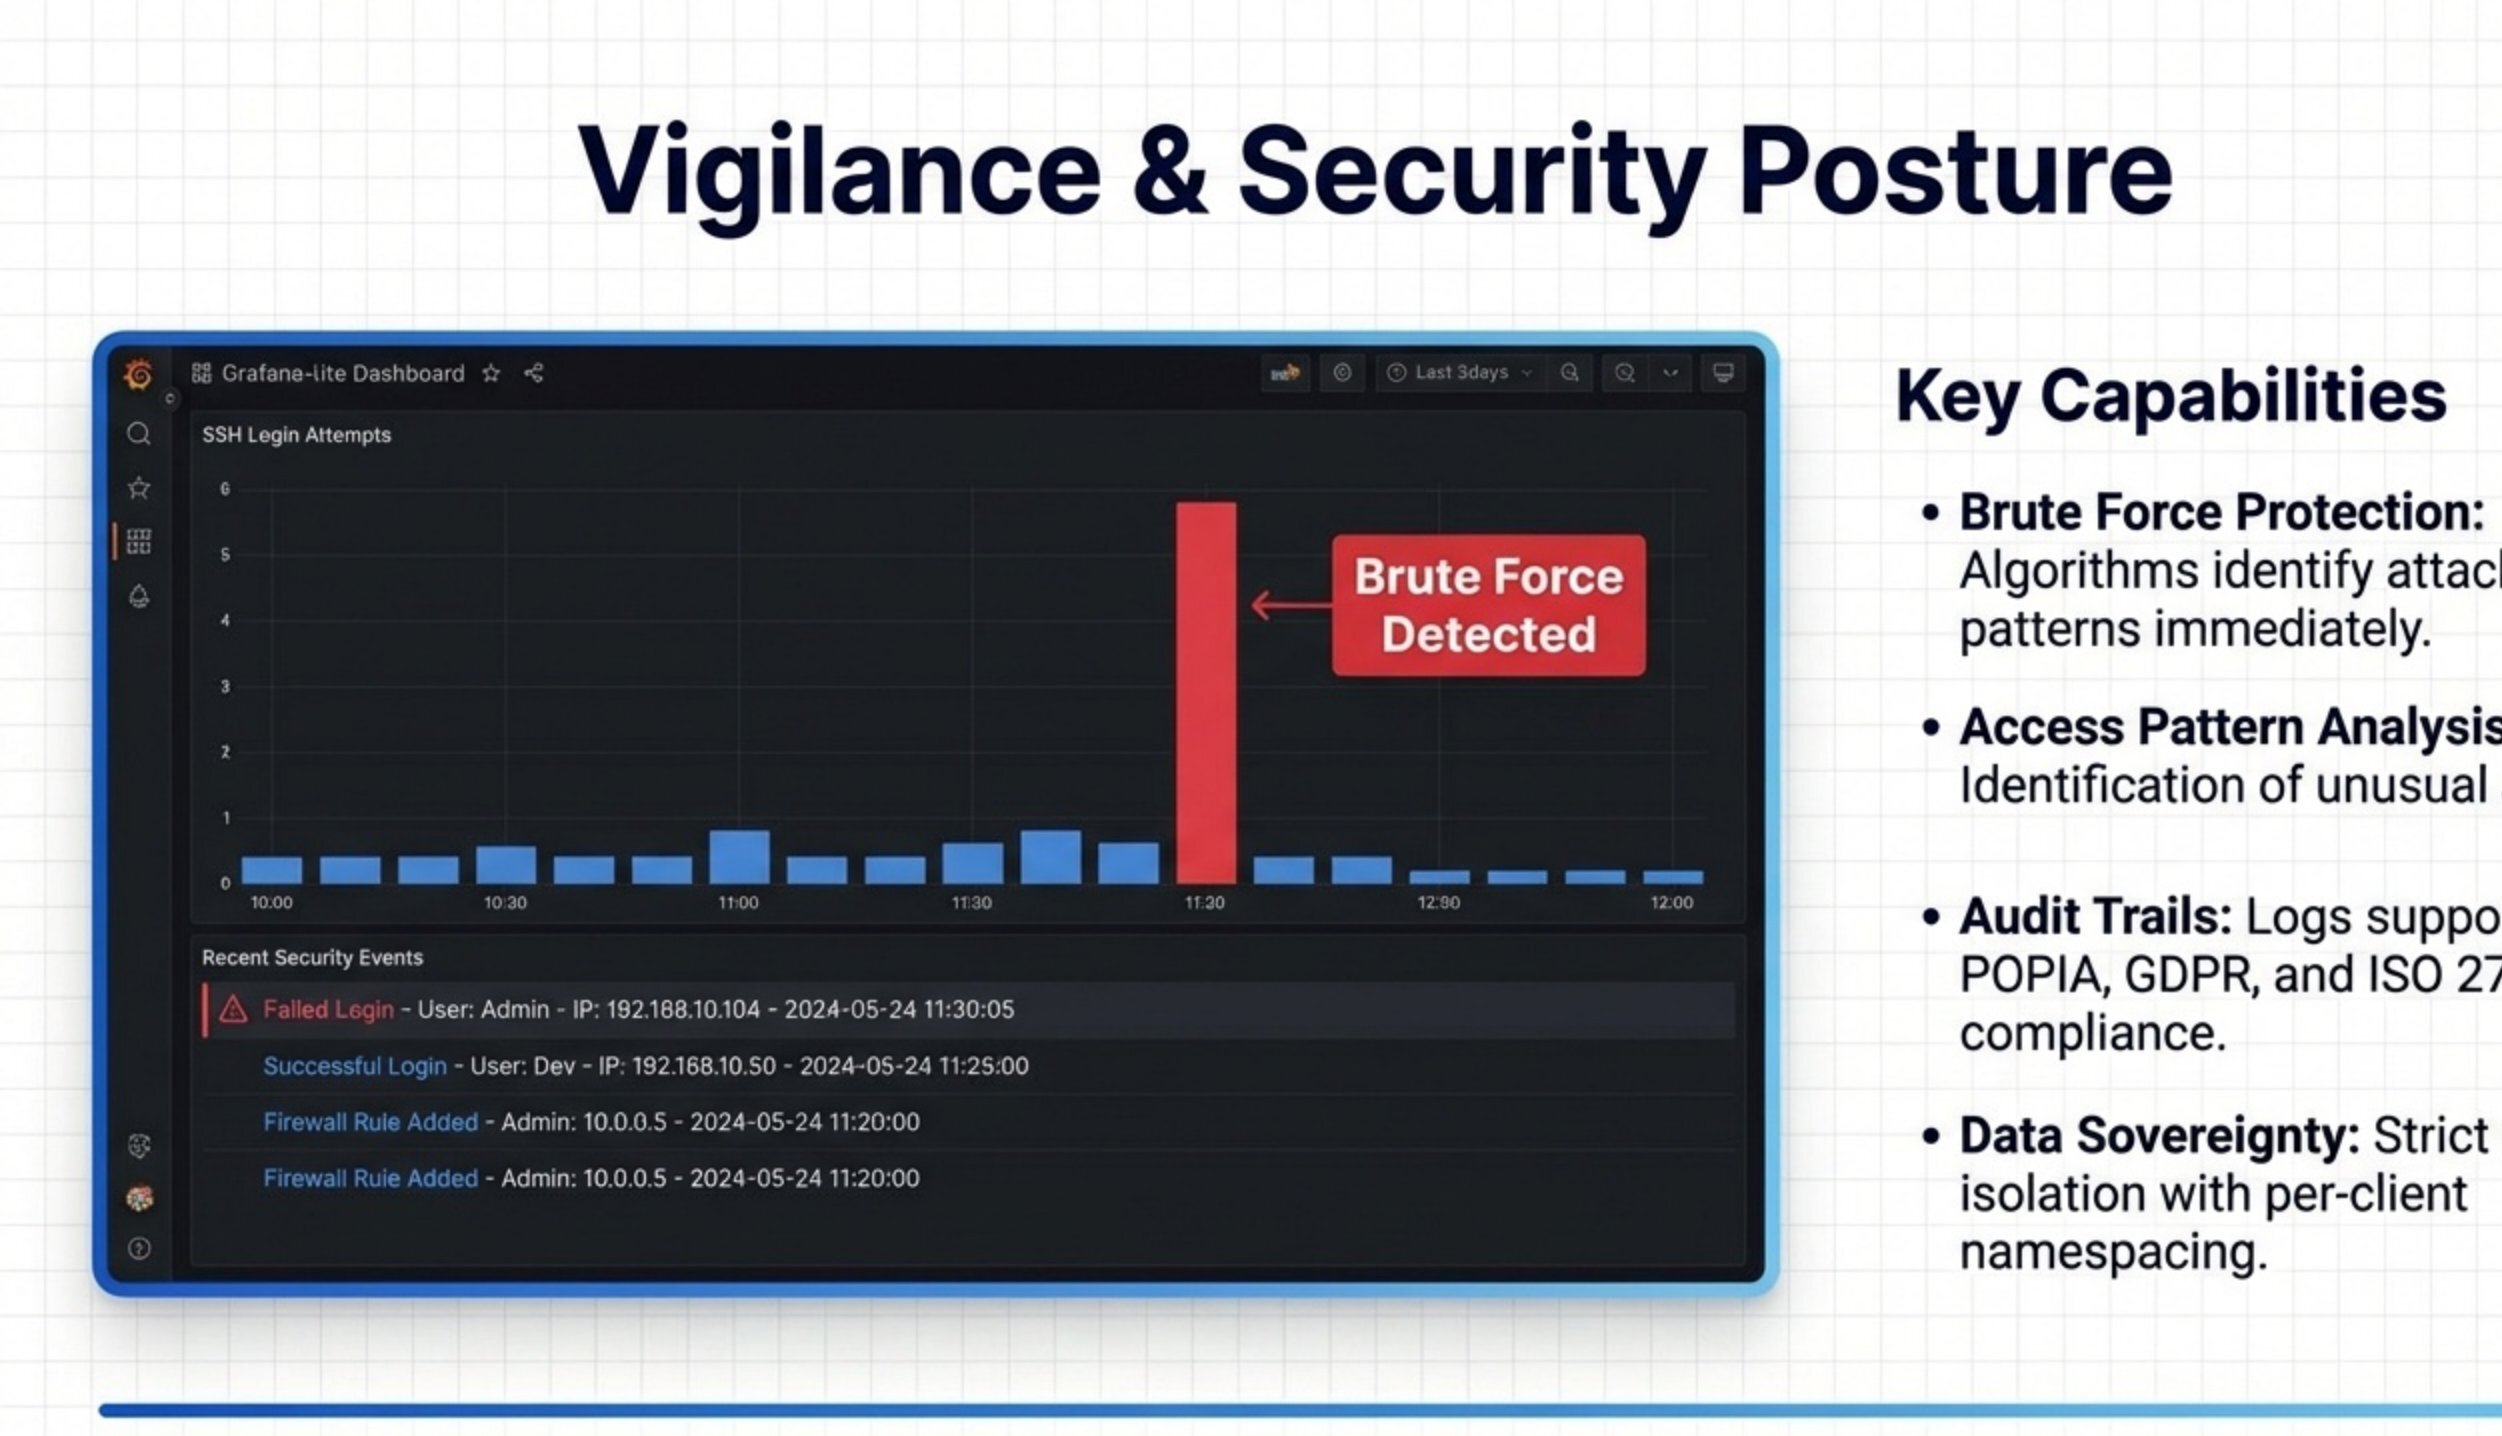
Key Security Capabilities
- Brute Force Protection: Algorithms identify attack patterns immediately, alerting on suspicious login attempts
- Access Pattern Analysis: Identification of unusual activity across your infrastructure
- Audit Trails: Comprehensive logs support POPIA, GDPR, and ISO 27001 compliance
- Data Sovereignty: Strict data isolation with per-client namespacing for multi-tenant security
- Real-Time Alerts: Security events trigger immediate notifications across all channels
- Historical Analysis: 30-day log retention for forensic investigation and compliance audits
Case Study: Umdoni Local Municipality
Real-world impact of managed observability for critical government infrastructure.
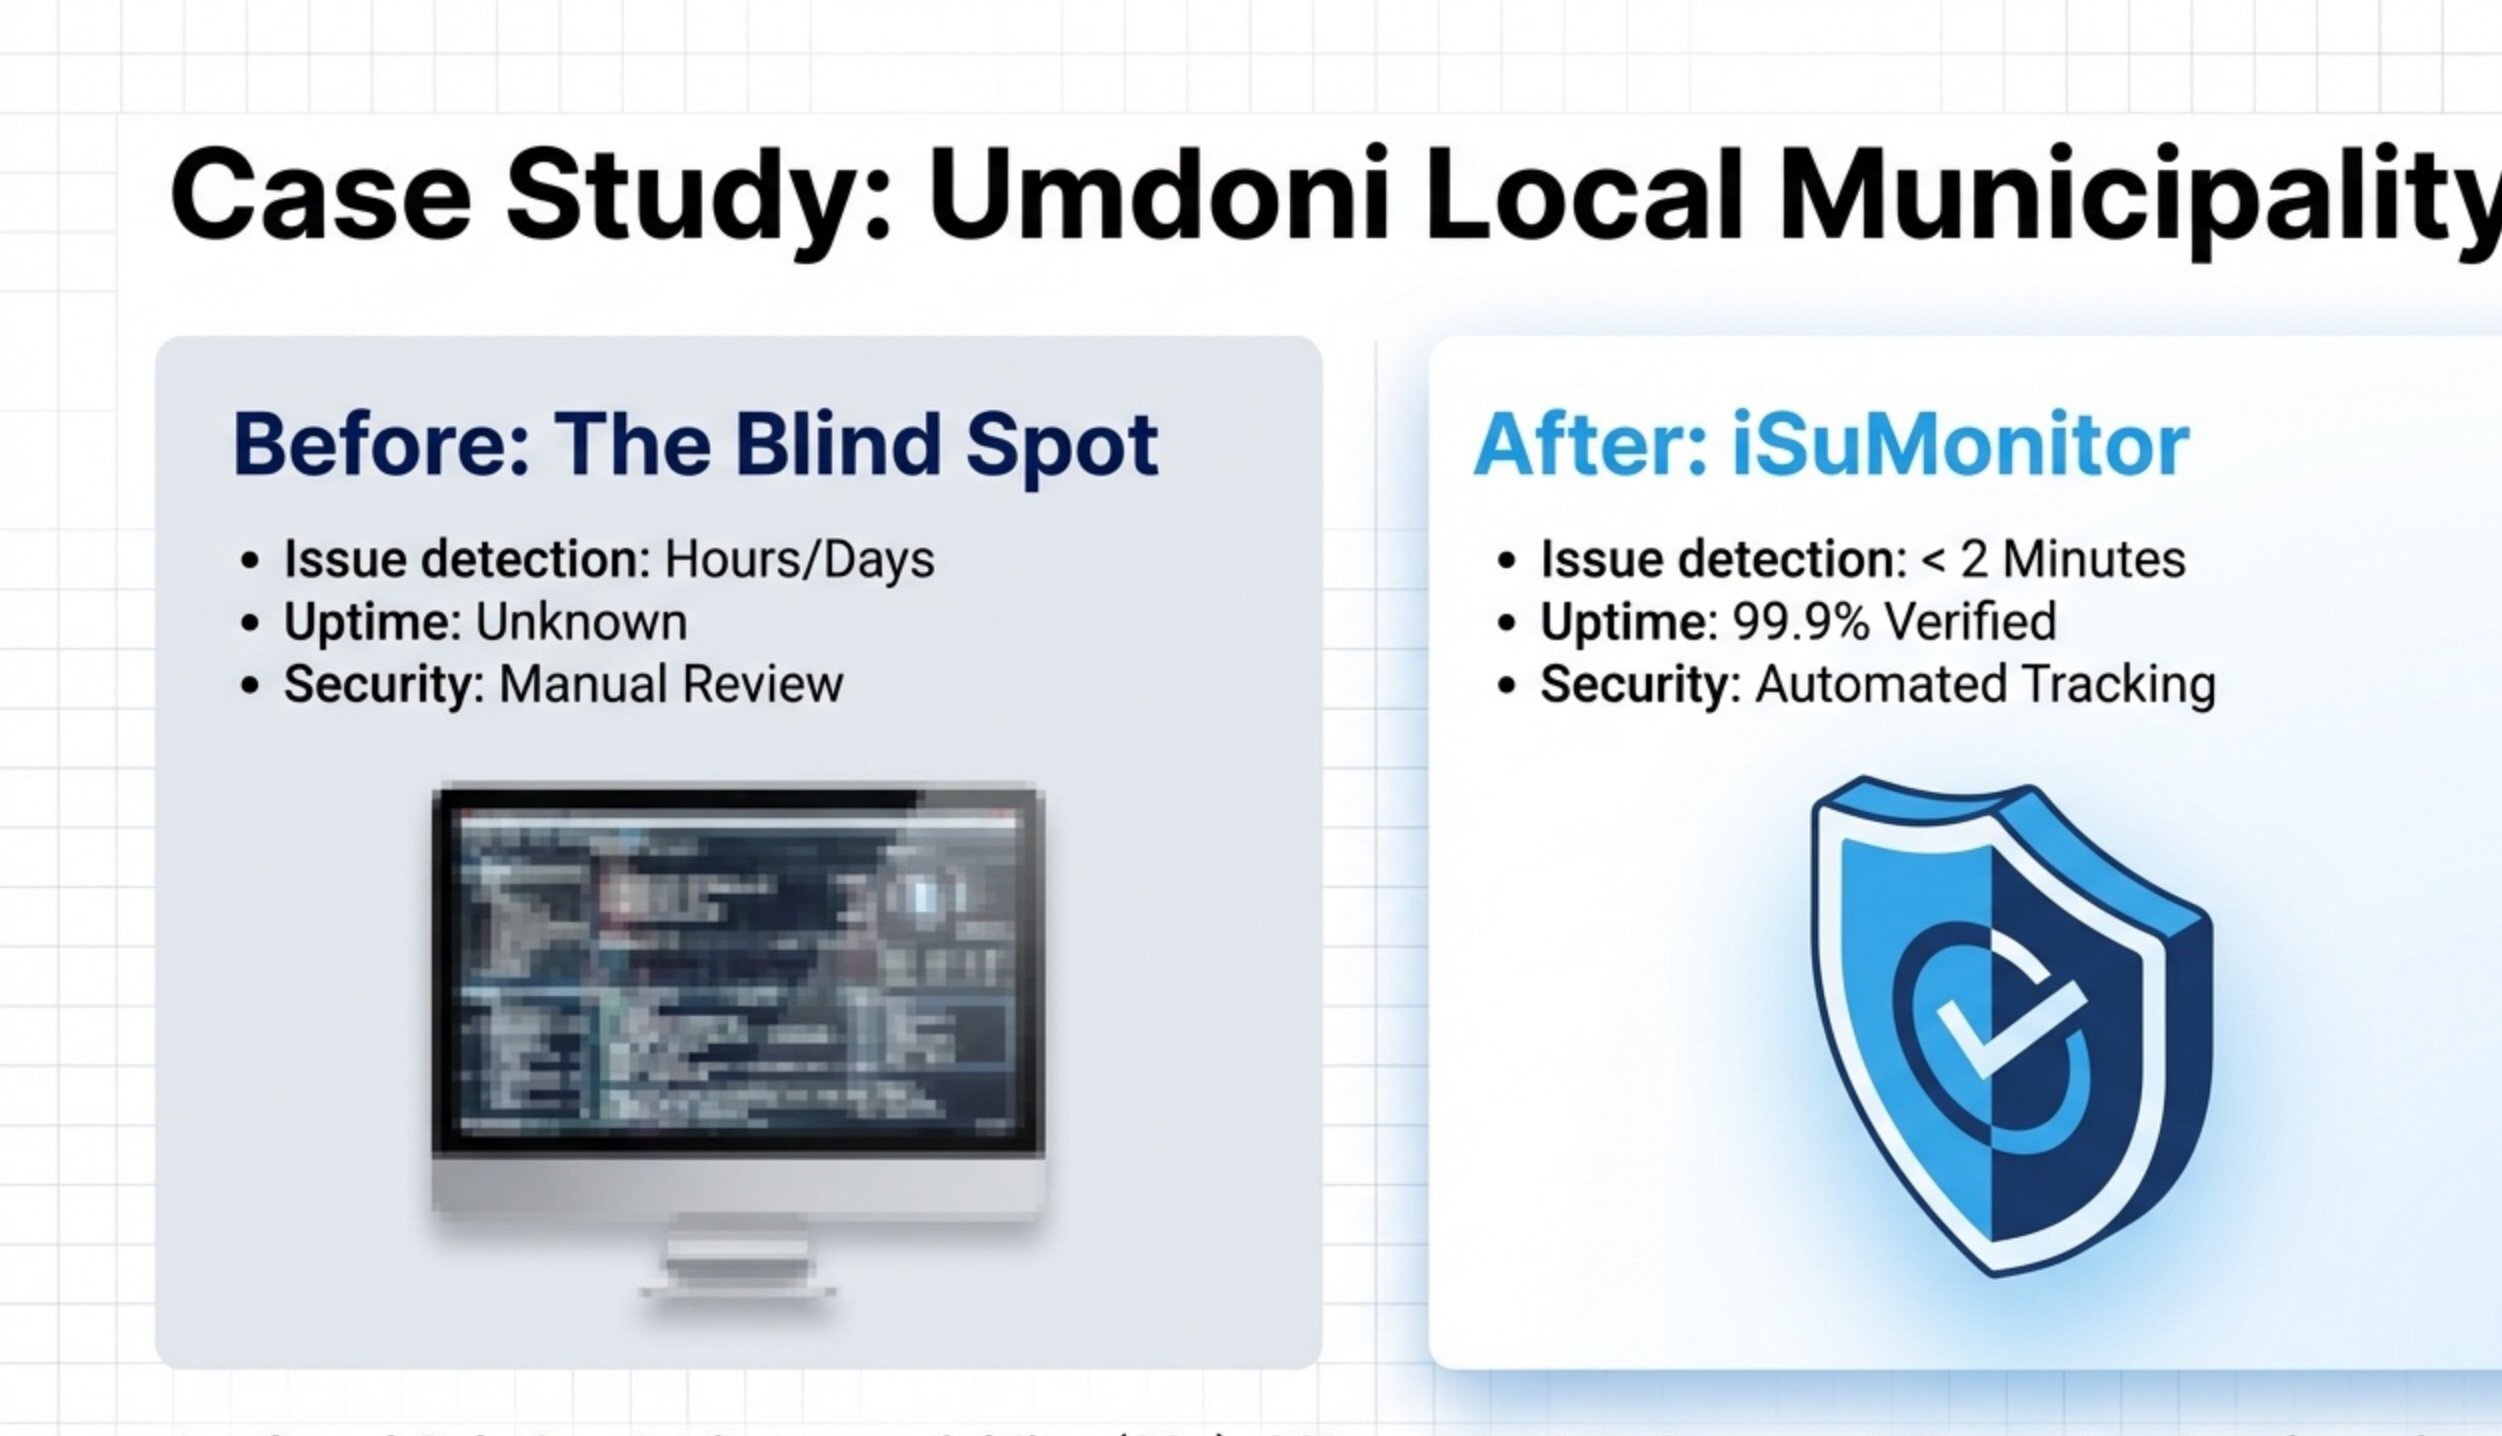
| Metric | Before: The Blind Spot | After: iSuMonitor |
|---|---|---|
| Issue Detection | Hours or Days | Under 2 Minutes |
| Uptime Visibility | Unknown | 99.9% Verified |
| Security Monitoring | Manual Review | Automated Tracking |
| Alert Delivery | None | Multi-Channel (Email, Slack, SMS) |
Deployed Solution
Monitoring: Website availability (30s intervals), SSL certificate monitoring, custom PHP application metrics, database health tracking
Result: Transformed from reactive firefighting to proactive infrastructure management, catching issues before citizens notice
The iSuMonitor Advantage
Why choose iSuMonitor over DIY monitoring or global enterprise solutions?
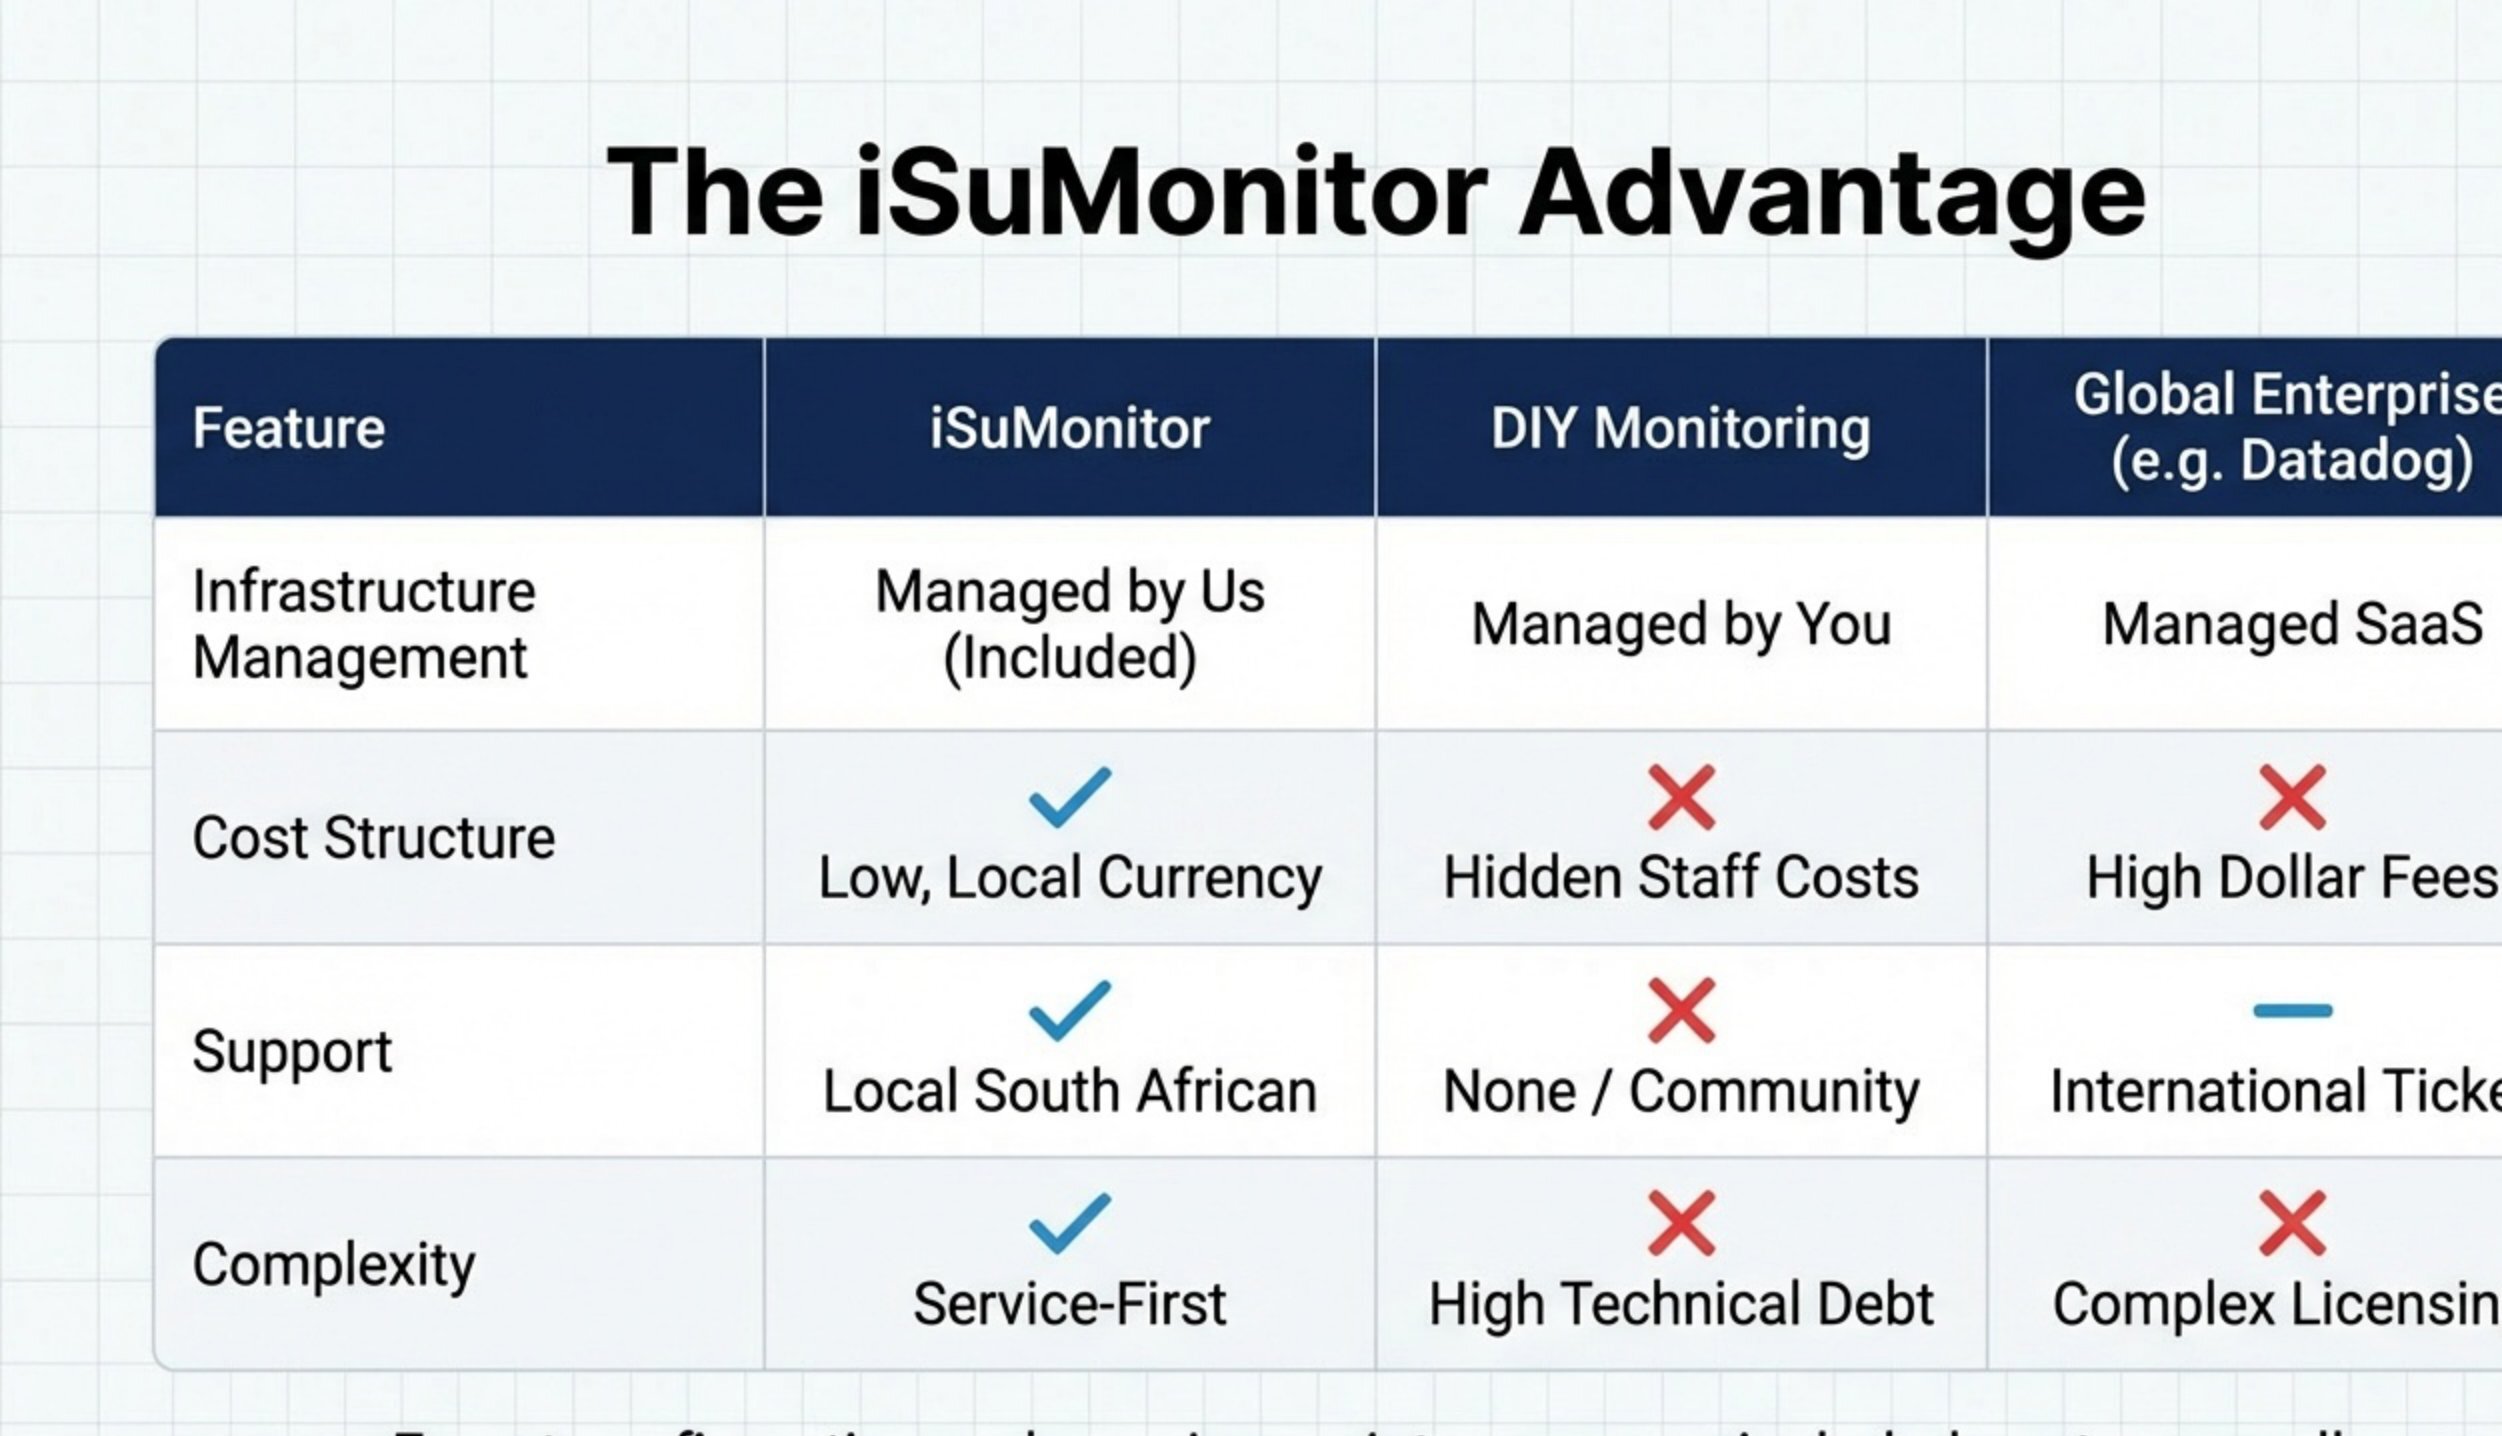
| Feature | iSuMonitor | DIY Monitoring | Global Enterprise (e.g. Datadog) |
|---|---|---|---|
| Infrastructure Management | ✓ Managed by Us (Included) | ✗ Managed by You | ✓ Managed SaaS |
| Cost Structure | ✓ Low, Local Currency | ✗ Hidden Staff Costs | ✗ High Dollar Fees |
| Support | ✓ Local South African | ✗ None / Community | — International Ticket |
| Complexity | ✓ Service-First | ✗ High Technical Debt | ✗ Complex Licensing |
Expert configuration and ongoing maintenance are included—not an upsell.
Service Packages
Flexible tiers designed for businesses at every stage, from small sites to mission-critical government infrastructure.
Essential
Small Business / Simple Sites
- Uptime Monitoring
- SSL Certificate Checks
- Monthly Reports
- Email Alerts
Professional
Growing Business / SaaS
- Application Metrics
- Database Monitoring
- 7-Day Log Retention
- Slack Alerts
Enterprise
Mission Critical / Government
- Full Security Monitoring
- 30-Day Log Retention
- Priority 4hr SLA
- Custom Dashboards
Custom solutions available for on-premise or PCI-DSS compliance needs.
Path to Visibility
Get from infrastructure blindness to complete observability in just 3-5 business days.
Implementation Process
- Step 1 - Consultation: Assess infrastructure and requirements
- Step 2 - Proposal: Scope definition and SLA agreement
- Step 3 - Onboarding (3-5 Days): Deploy monitoring agents, configure dashboards, set alerting rules
- Step 4 - Go-Live: 24/7 production monitoring begins immediately
Typical Professional package timeline: Just 3-5 business days.
Secure Your Infrastructure Today
Don't wait for the next outage to realize you need visibility. Get enterprise-grade observability with local South African support.
Request Custom ProposalYour Infrastructure's Heartbeat.